CURV: Enhancing Chart Understanding Through Curriculum Visual Grounded Reasoning
1William & Mary 2Northwestern University 3Adobe 4University of Illinois, Urbana-Champaign
Abstract
Chart question answering requires multimodal large language models to integrate visual comprehension with logical reasoning, yet current models struggle with accurate visual grounding and coherent reasoning chains. While extrinsic chain-of-thought prompting and visual cues significantly improve performance, current MLLMs lack intrinsic visual grounded reasoning capabilities, leading to inaccurate perception and reasoning disconnected from visual evidence. We propose CURV, a curriculum learning framework that develops intrinsic visual reasoning by reformulating chart question answering as multi-step visual grounded reasoning, where each step coordinates logical reasoning with dynamic visual grounding. To support model learning, we introduce CCQA, a three-level curriculum dataset with scalable synthetic generation across diverse chart types and reasoning patterns. Experiments show gains of up to ↑20.50% over baselines, with generalization to real-world benchmarks (↑12.30%) and out-of-domain multimodal reasoning (↑10.20%).
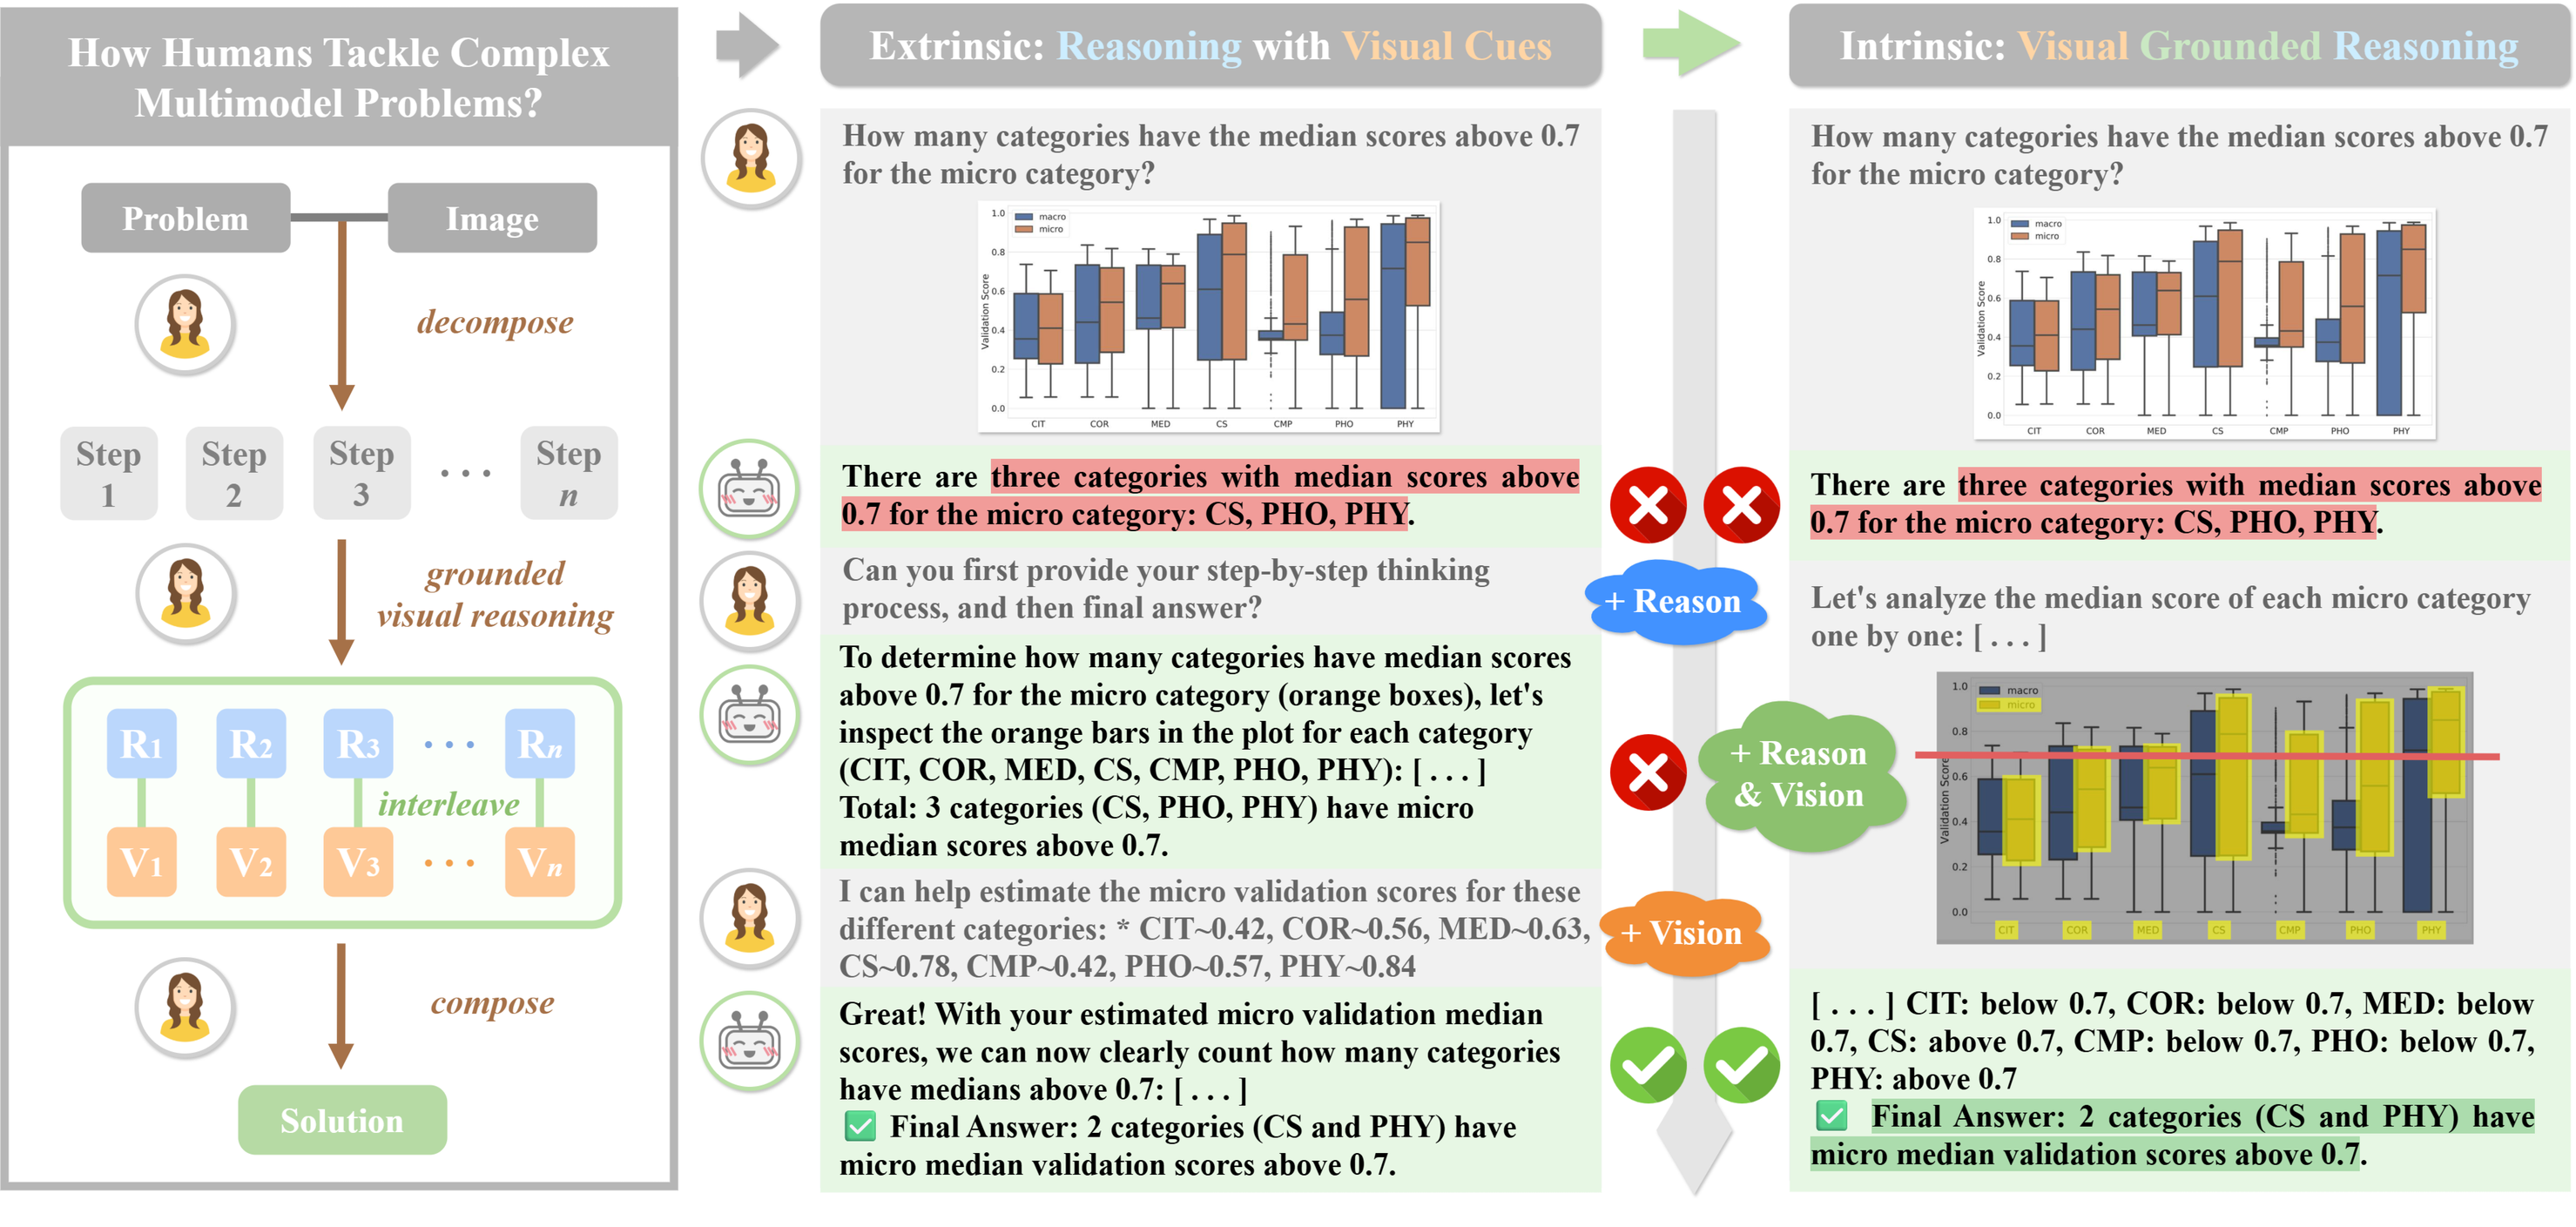
What Prohibits Chart Understanding?
We evaluate GPT-4o on 60 CQA samples from CharXiv under four generation modes to isolate where failures come from. Reasoning alone helps (↑10.00%), visual grounding alone helps more (↑18.33%), but combining both is transformative (↑43.33%) — and vision errors drop to zero.
Preliminary: Where CQA Fails
| Mode | Vision err. | Reasoning err. | Answer err. | Acc (%) | Δacc (%) |
|---|---|---|---|---|---|
| A | – | – | 34 | 43.33 | – |
| VA | 0 | 18 | 5 | 61.67 | ↑18.33 |
| RA | 17 | 6 | 5 | 53.33 | ↑10.00 |
| RVA | 0 | 5 | 3 | 86.67 | ↑43.33 |
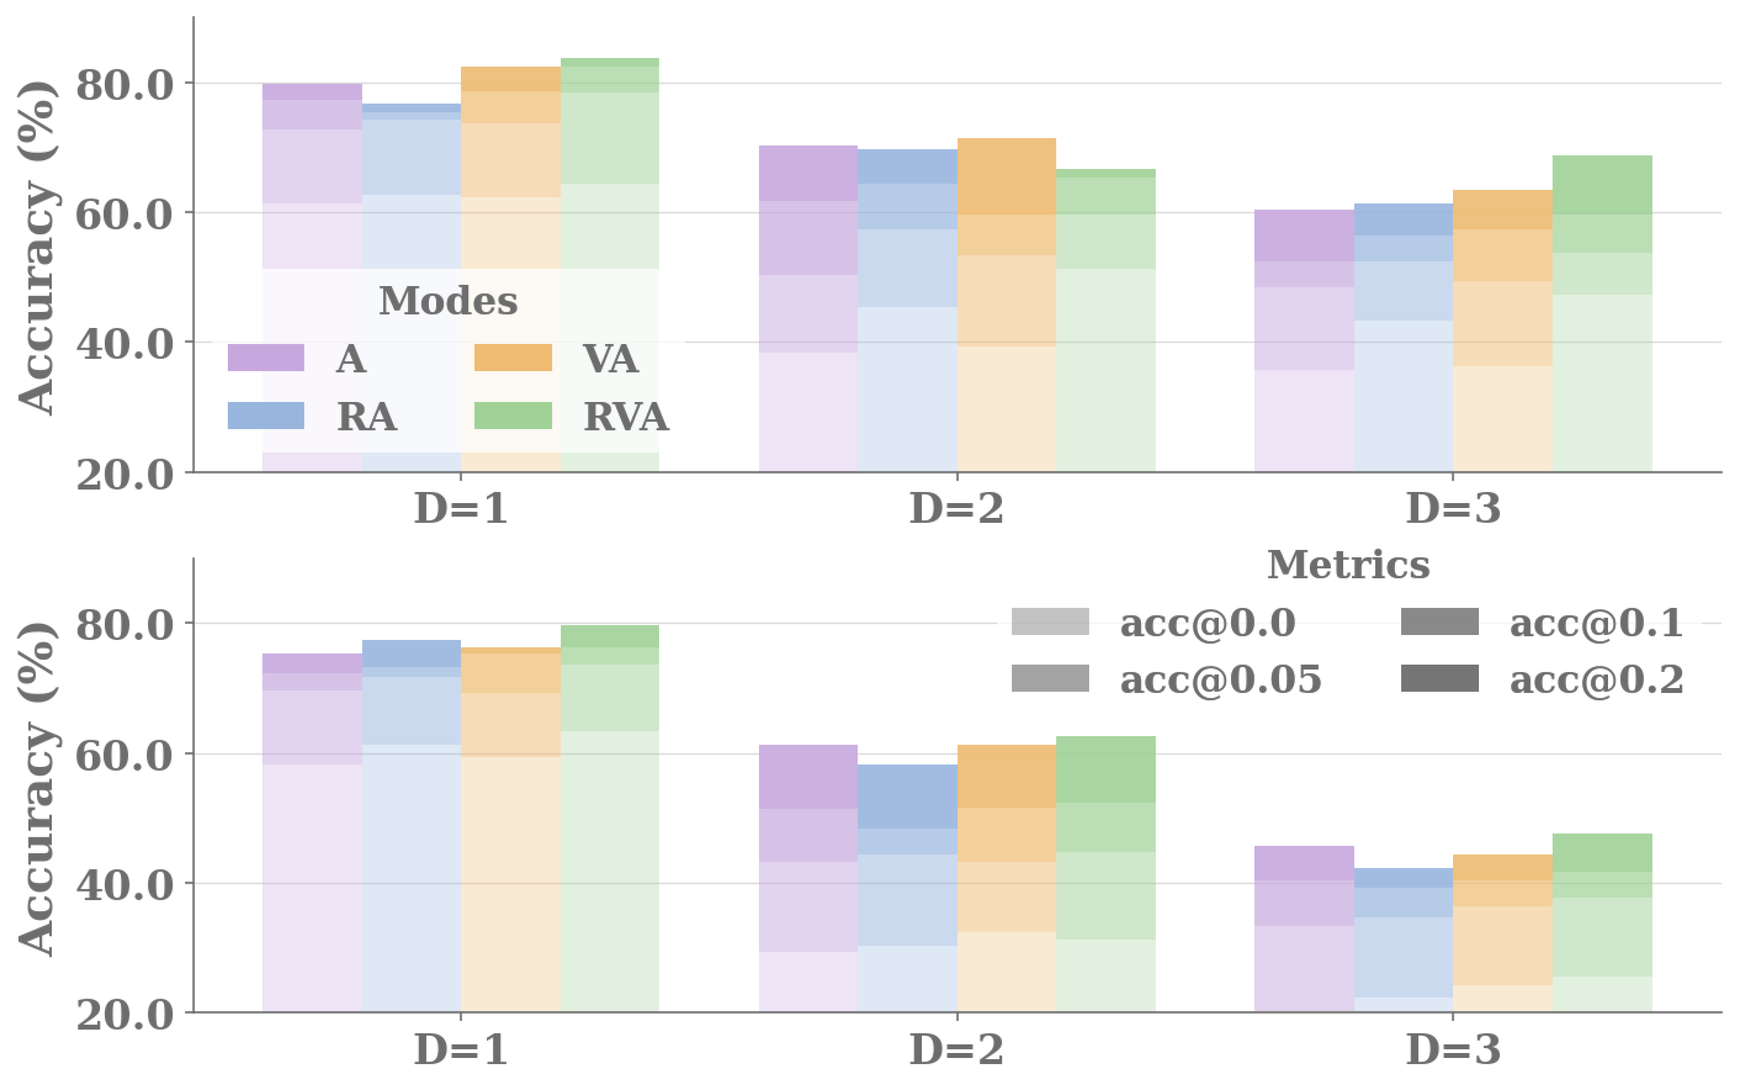
Extrinsic assistance helps at every depth
Both models improve when given reasoning or visual grounding, and improve most when given both — even as reasoning depth rises from D = 1 to D = 3.
That consistency is what motivates internalizing these capabilities rather than supplying them from outside at inference time.
Decomposition
Models struggle to break complex questions into coherent reasoning chains, producing inconsistent or logically flawed intermediate steps.
Interleaved Visual Reasoning
Individual steps are poorly grounded in the image — misread values, attention on the wrong regions.
Composition
Reasoning and grounding are not integrated across steps, disconnecting what is perceived, reasoned, and concluded.
CCQA: Curriculum Chart Question Answering
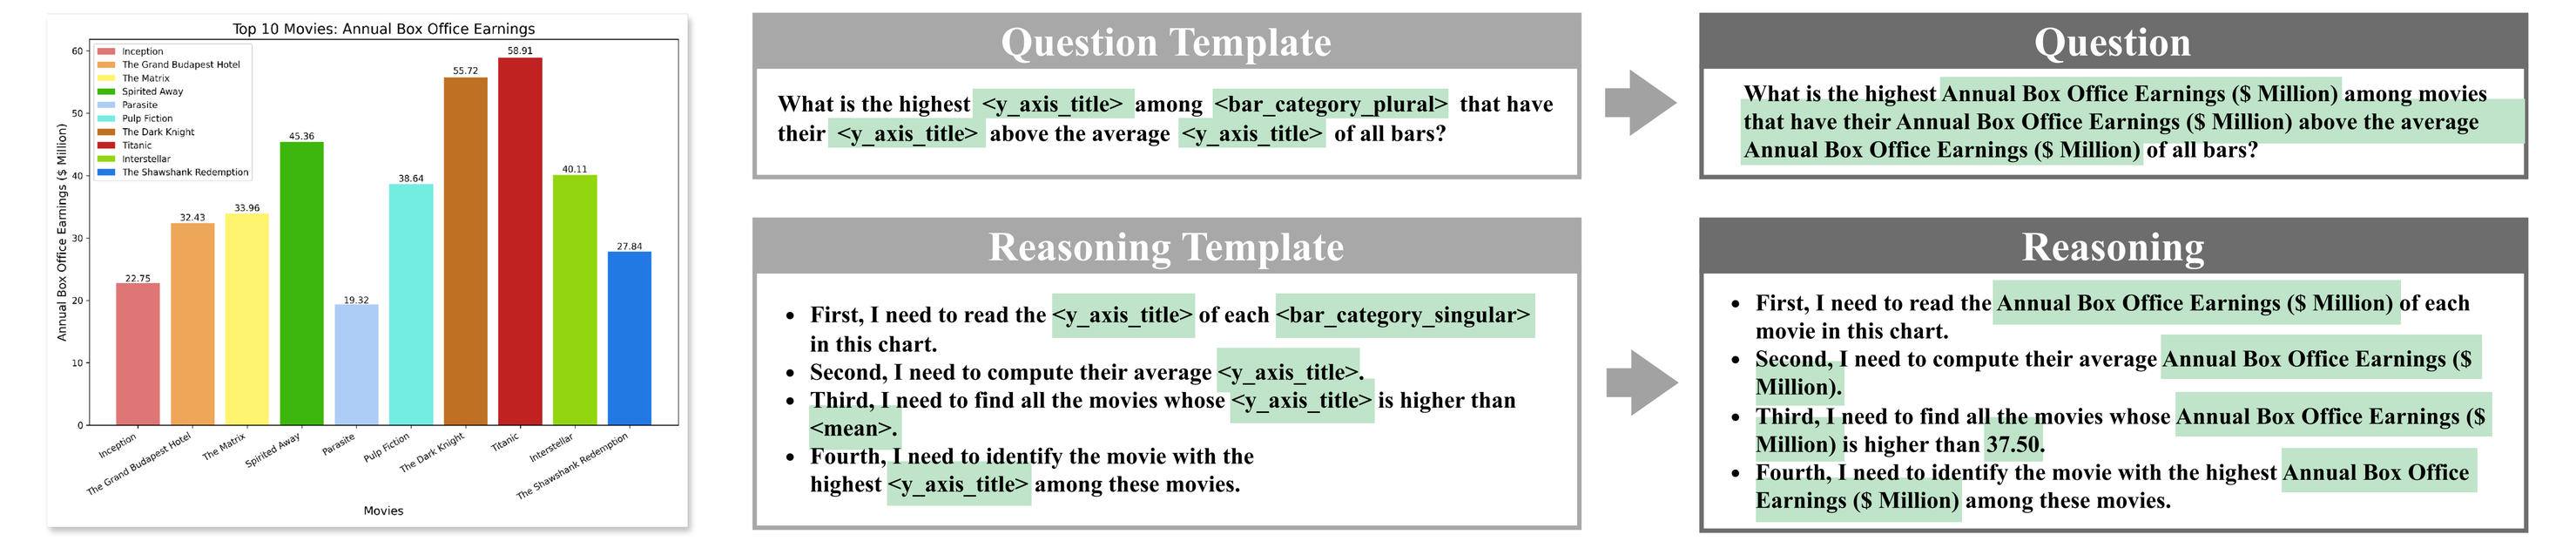
CCQA is generated entirely from human-authored templates, with no model in the loop. Every question, reasoning step, grounding box, and answer is computed deterministically from the plotting data, which is what guarantees ground-truth correctness at scale. Each reasoning step Rt is paired with ground-truth grounding V*t and a binary mask M*t.
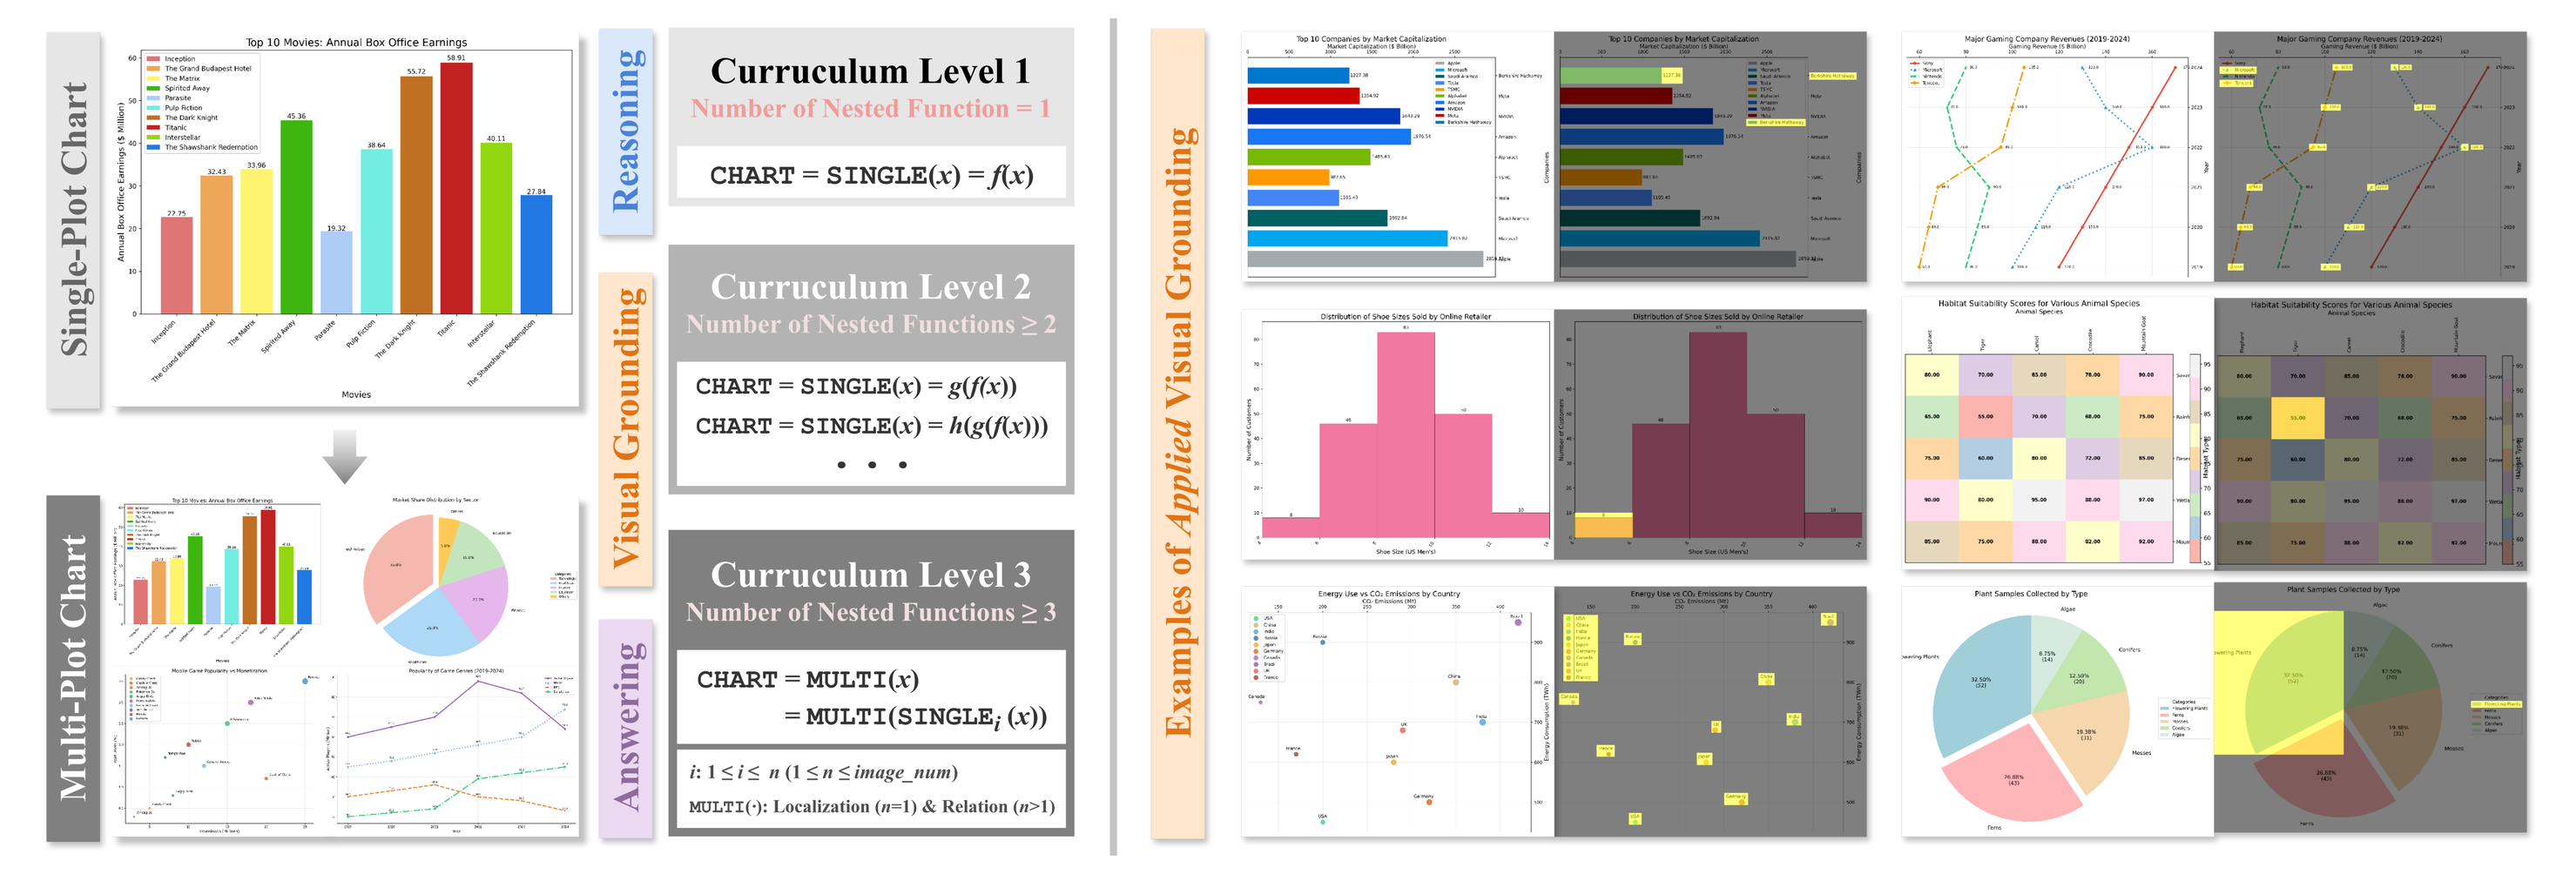
Three Curriculum Levels, Five Tiers
Level 1 — Foundational
Single-operation reasoning on single-plot charts, reasoning depth D = 1. Direct value reading, simple arithmetic, elementary comparison.
Level 2 — Multi-Operation
Nested operations on single charts, D ≥ 2. Each step builds on previous computations, spanning tiers 2 and 3.
Level 3 — Multi-Chart
Complex reasoning across subplots, D ≥ 3. Tier 4 requires subplot localization; tier 5 additionally requires modeling relations across subplots.
Foundational Operators
Twelve operators compose in atomic or nested form across chart components and subplots. Nesting depth is what controls curriculum difficulty.
| Operator | Description |
|---|---|
| Read | Read or estimate the value of chart components meeting given requirements |
| Statistics: Sum / Mean / Median | Aggregate a group of chart components |
| Statistics: Count | Count the components meeting given requirements |
| Extrema: Value | Minimum or maximum value, possibly under nested functions |
| Extrema: Position | Localize components such as the leftmost bar |
| Sort: Ascending / Descending | Order a group of components |
| Compare: Value / Diff / Position | Compare two groups of components |
| Filter | Select components satisfying a predicate |
| Threshold | Identify components against a threshold condition |
| Subset | Identify the subset satisfying a specification |
| Localization | Localize specific components or subplots |
| Relation | Reason over relations across components or subplots |
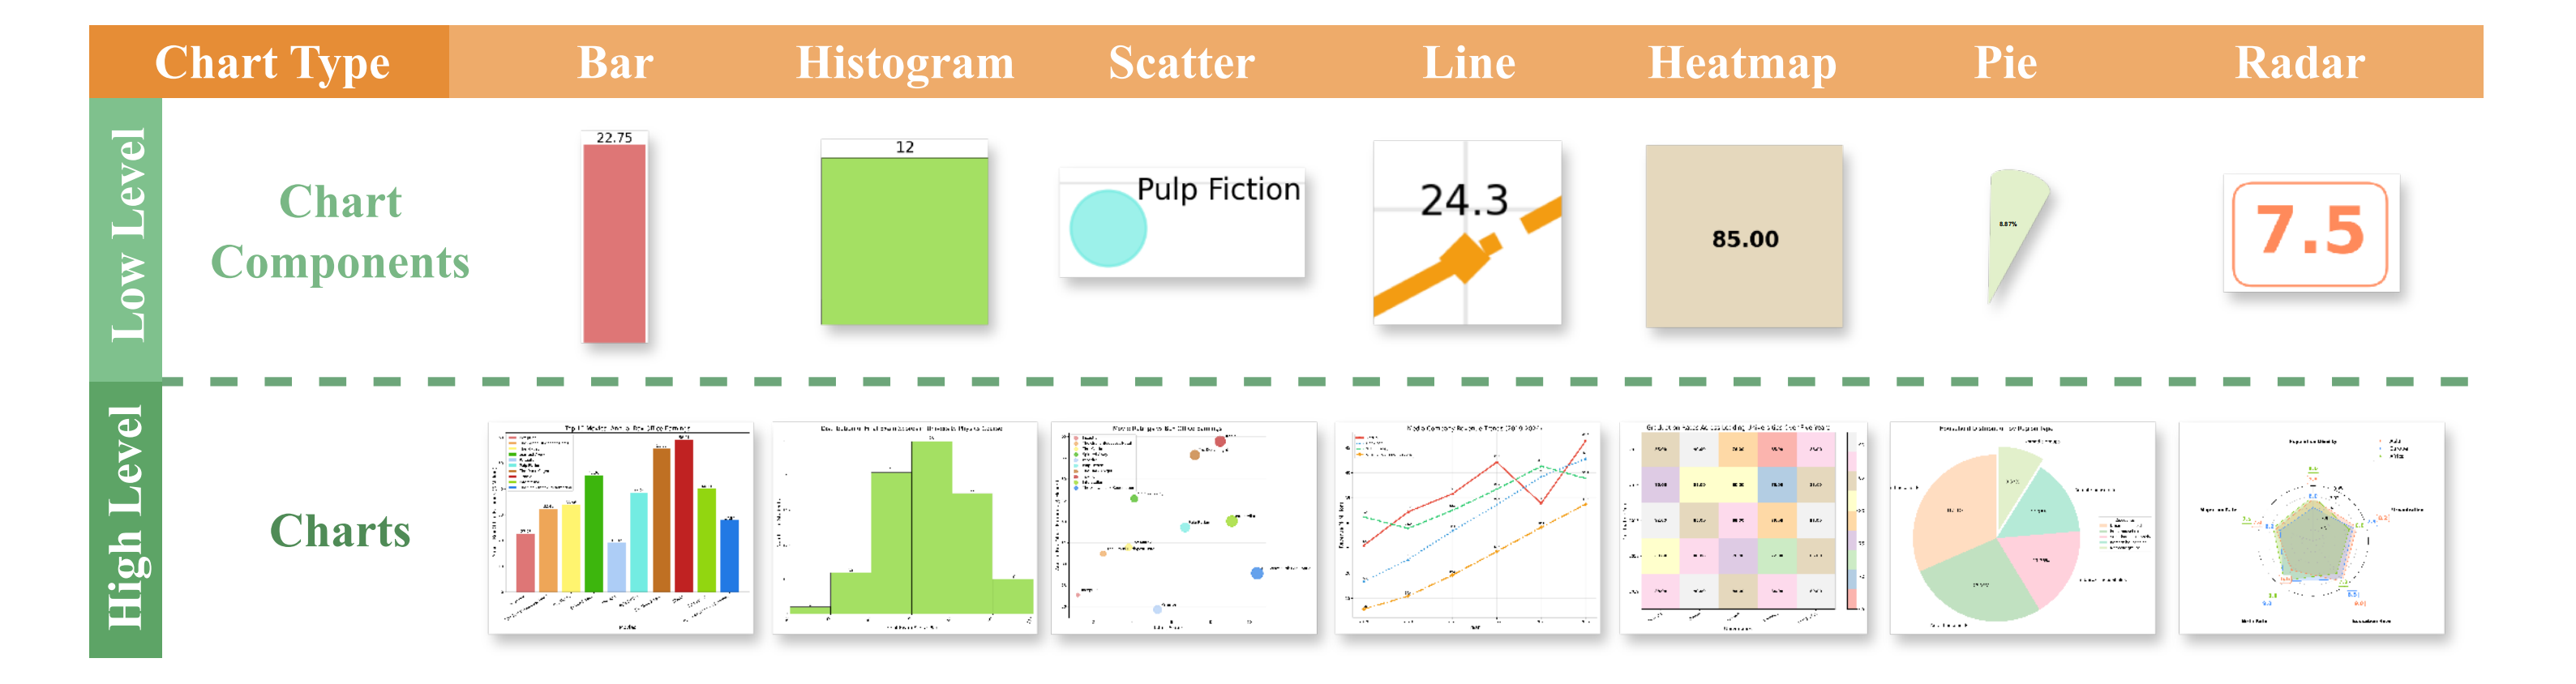
Seven chart types, thirty domains
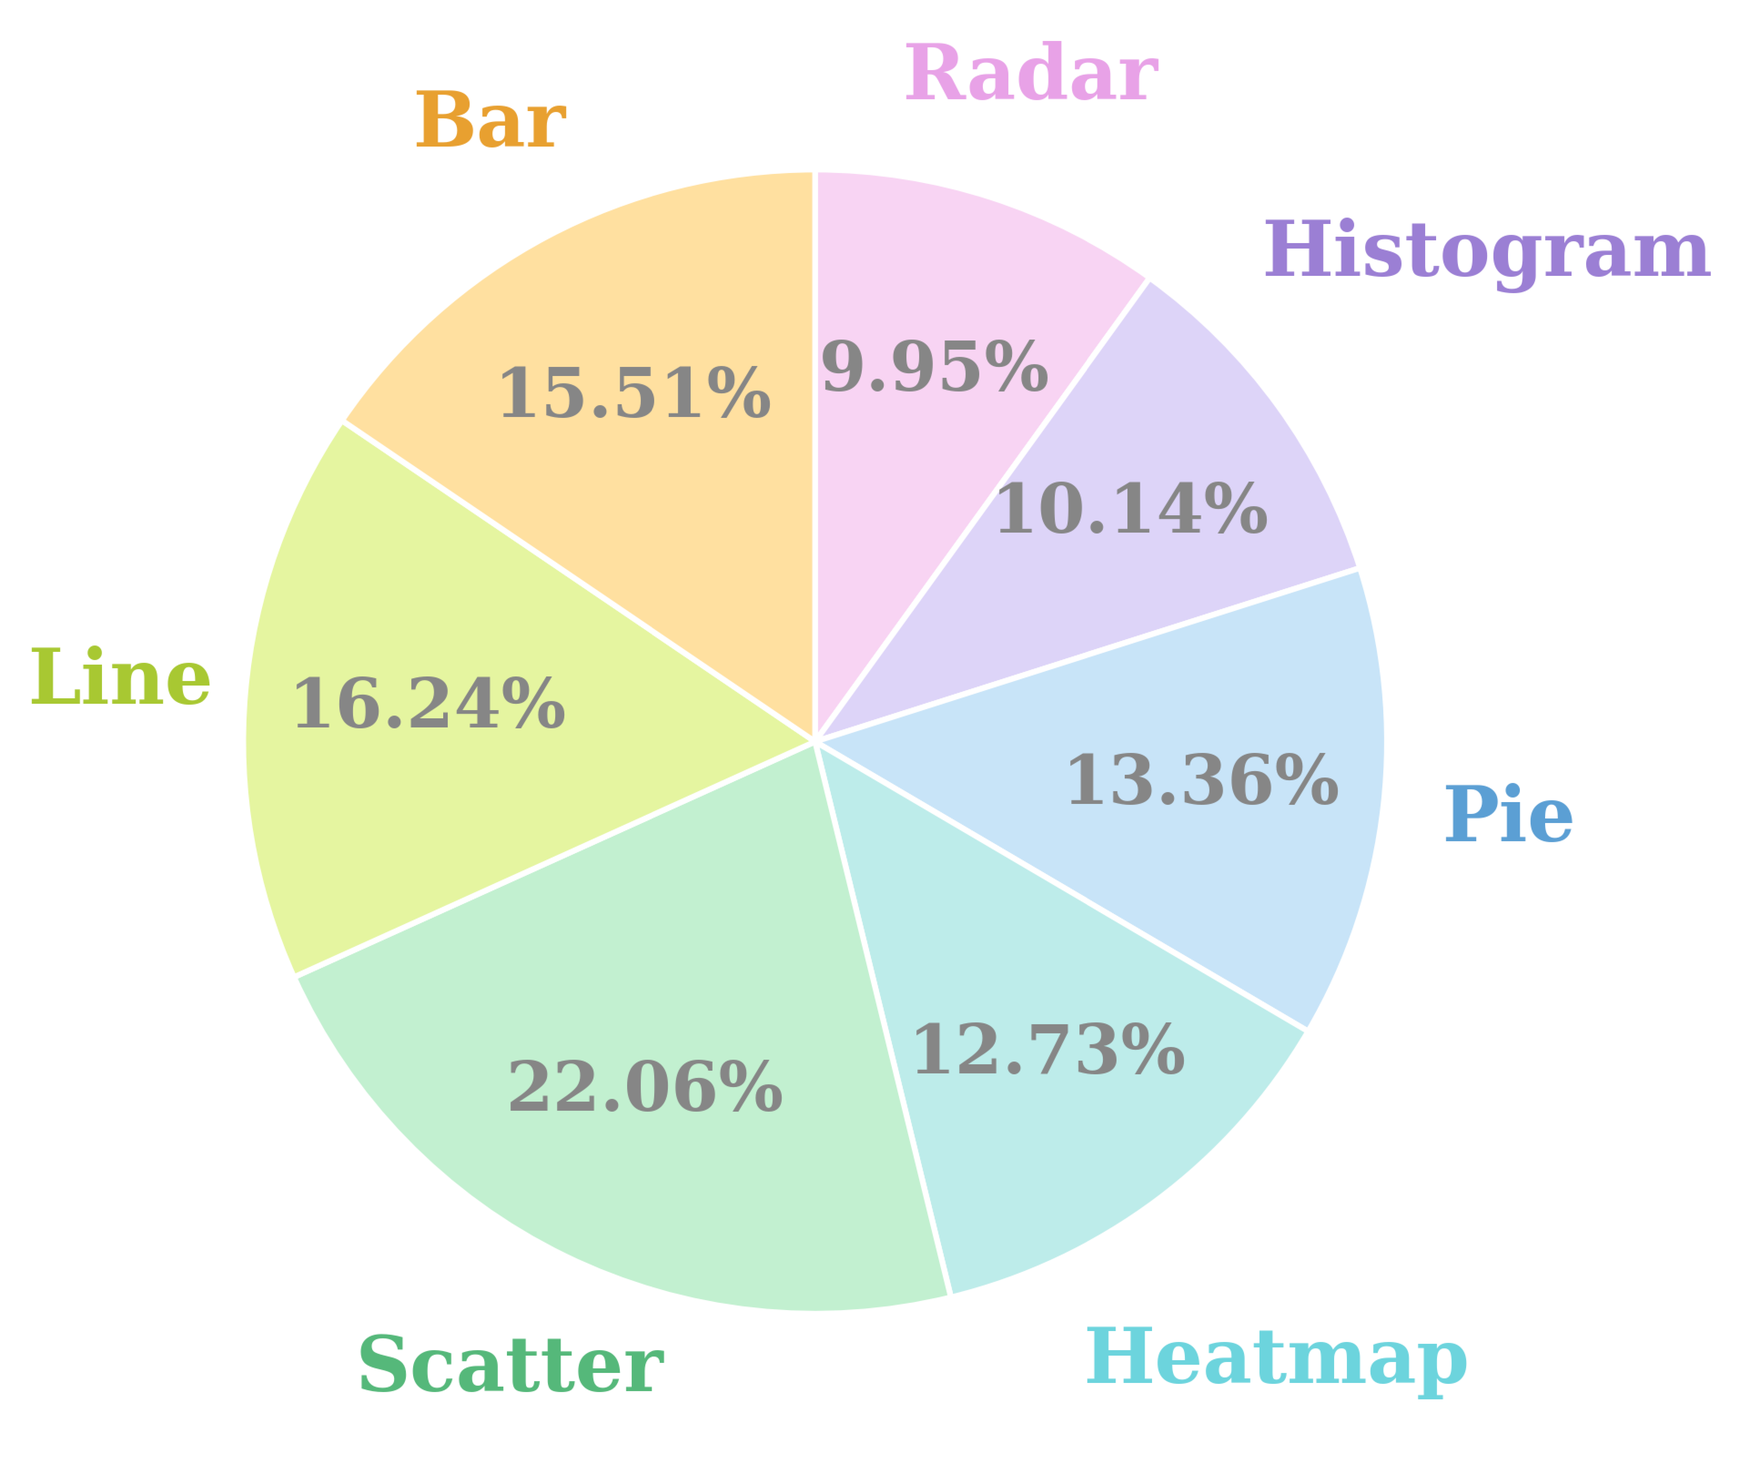
Bar, histogram, scatter, line, heatmap, pie, and radar. Sample counts differ by type because they depend on chart features — scatter plots key on both axes, heatmaps on cell values and labels — and on the source plotting data.
CURV: Curriculum Visual Grounded Reasoning
Rather than learning the direct mapping fθ: (I, Q) → A, CURV decomposes chart question answering into a structured progressive chain in which every reasoning step is anchored to a visual region:
fθ: (I, Q) → {(R1, V1), (R2, V2), …, (RT, VT)} → A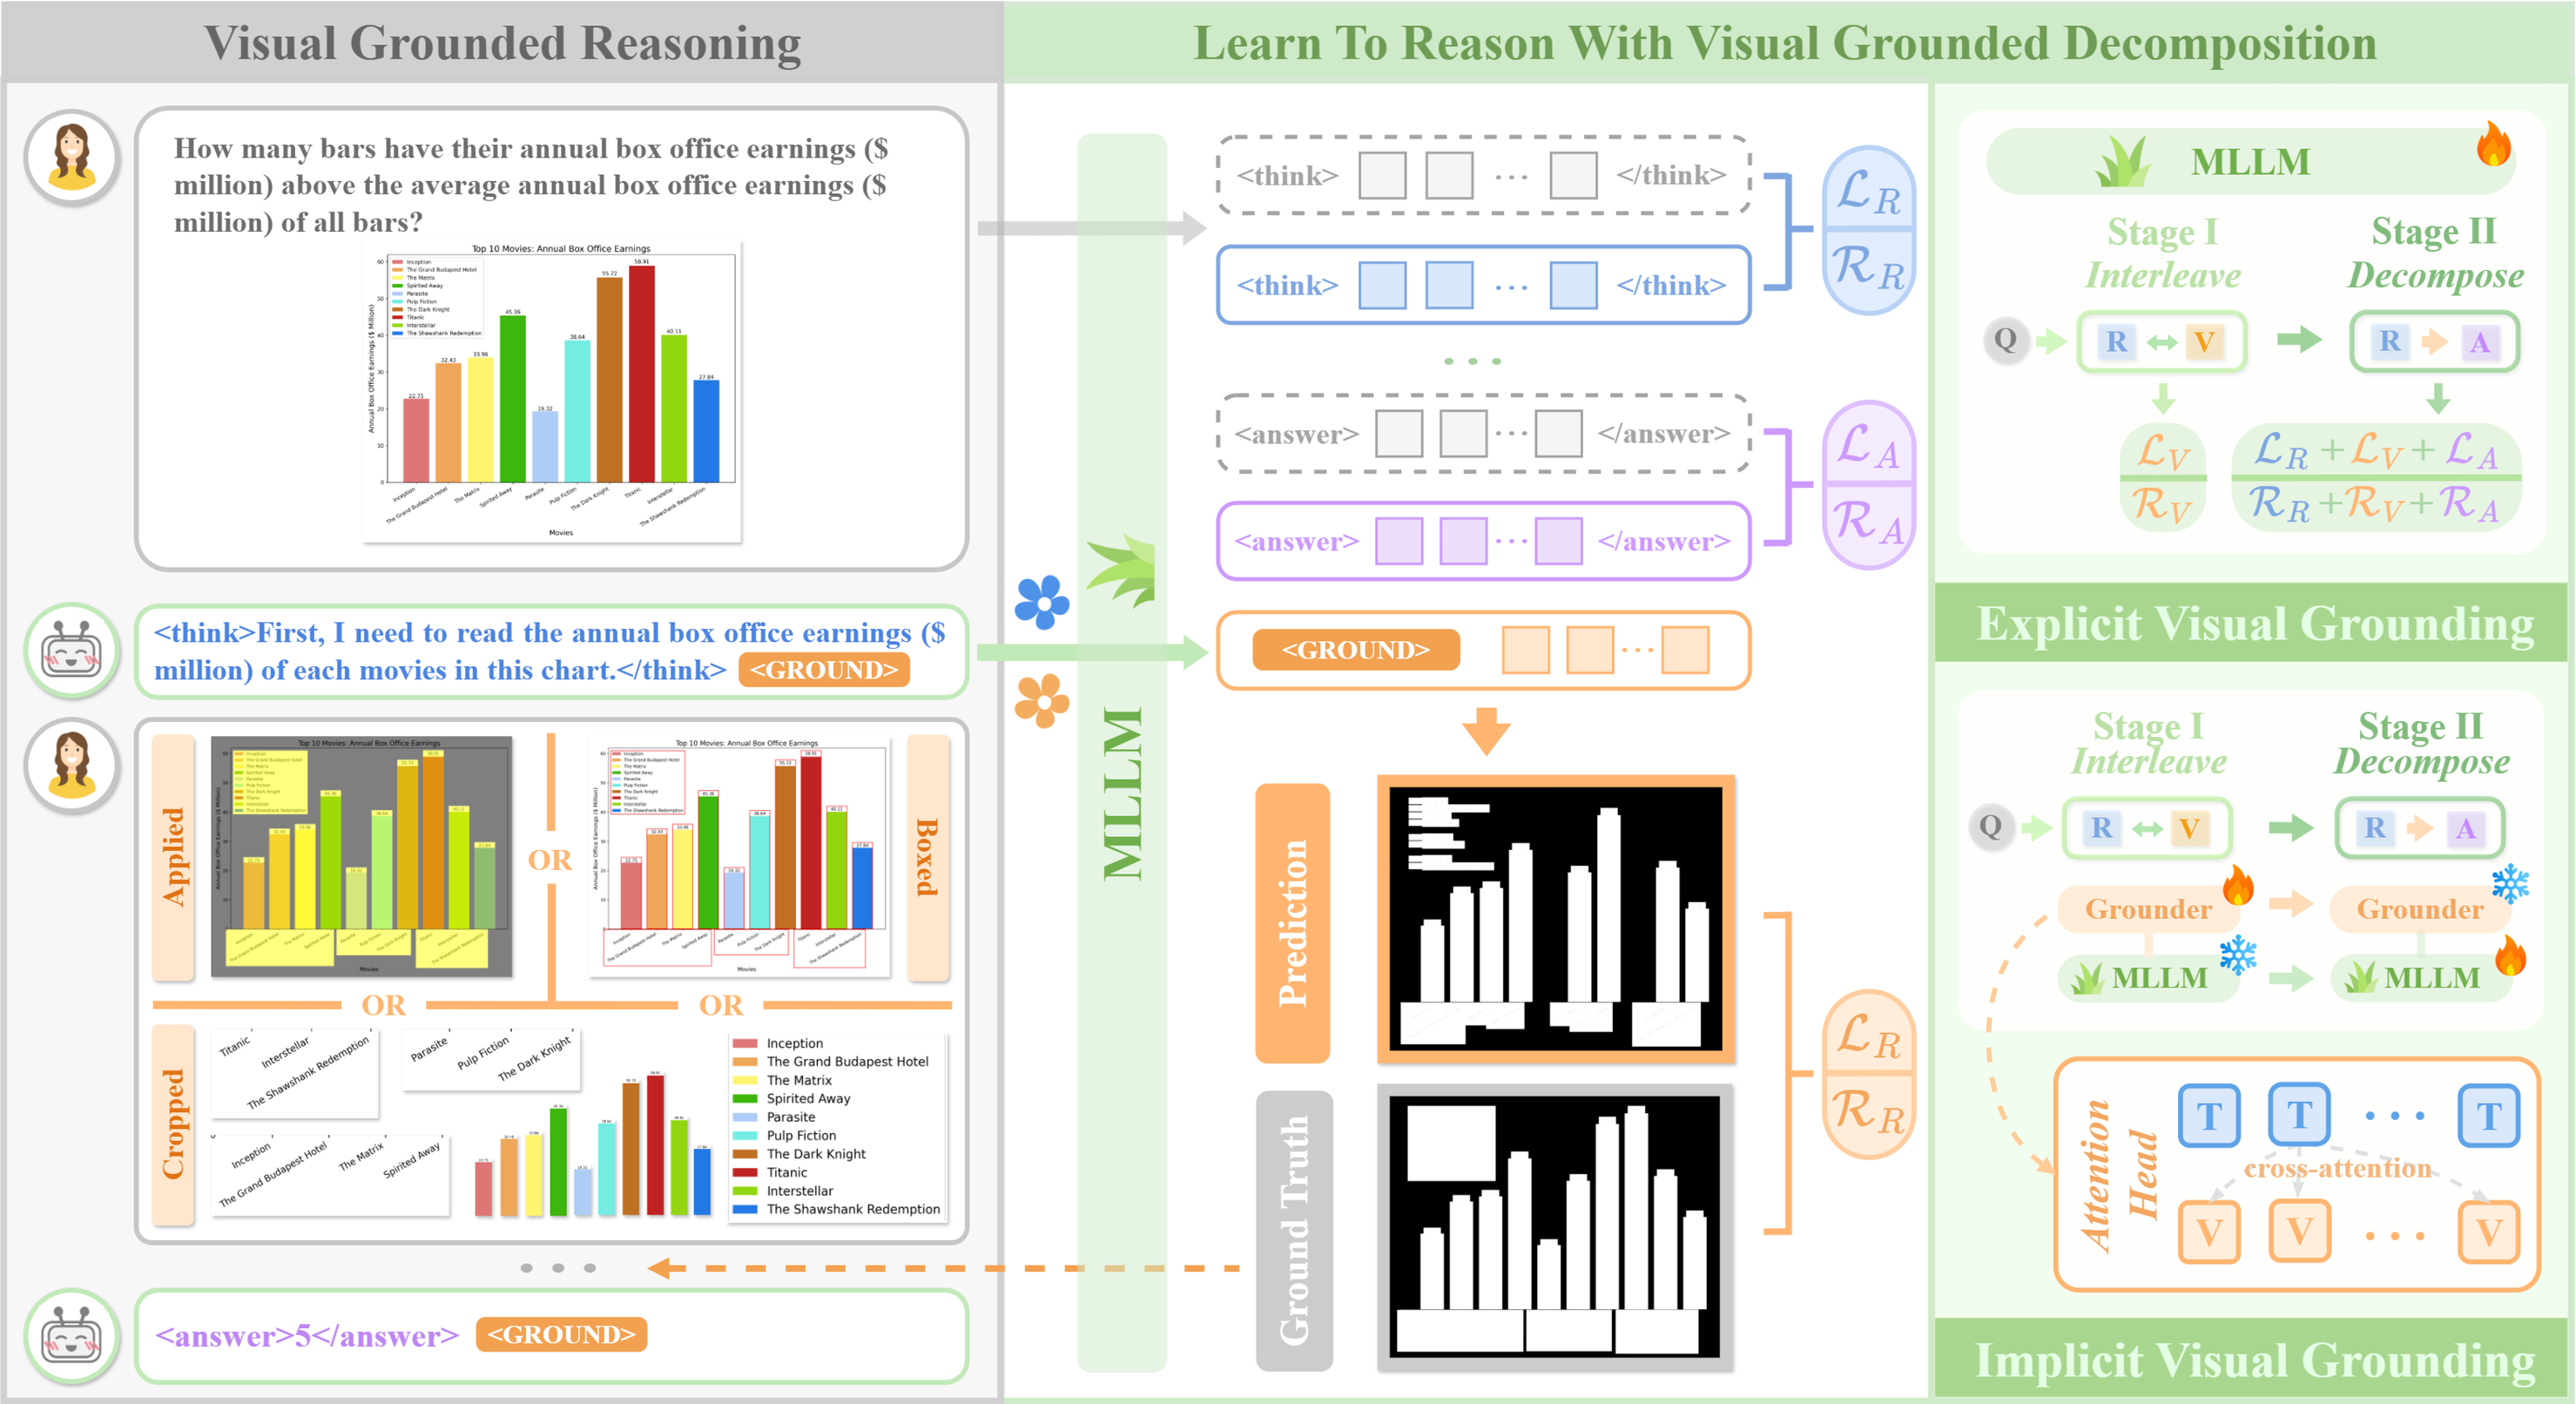
Two-Stage Curriculum Training
Stage I — Visual Grounding (RV)
The model learns to place the visual focus Vt that grounds a given reasoning step Rt, conditioned on prior grounding pairs. Only grounding is supervised.
Vt = f(S1)θ(I, Q, {Rt', Vt'}t-1, Rt)Stage II — Interleaved Reasoning (RVA)
Grounding becomes feedback: Vt is applied to the image to form the grounded state It, which conditions the next step. Reasoning, grounding, and the final answer are all supervised.
(Rt, Vt) = f(S2)θ(I, Q, {Rt', Vt' → It'}t-1)- Reasoning steps (T) — how many CoT steps the model takes to reach the answer.
- Reasoning depth (D) — the maximum nesting of logical functions the task requires, independent of how many steps a model uses.
Visual Grounding Strategies
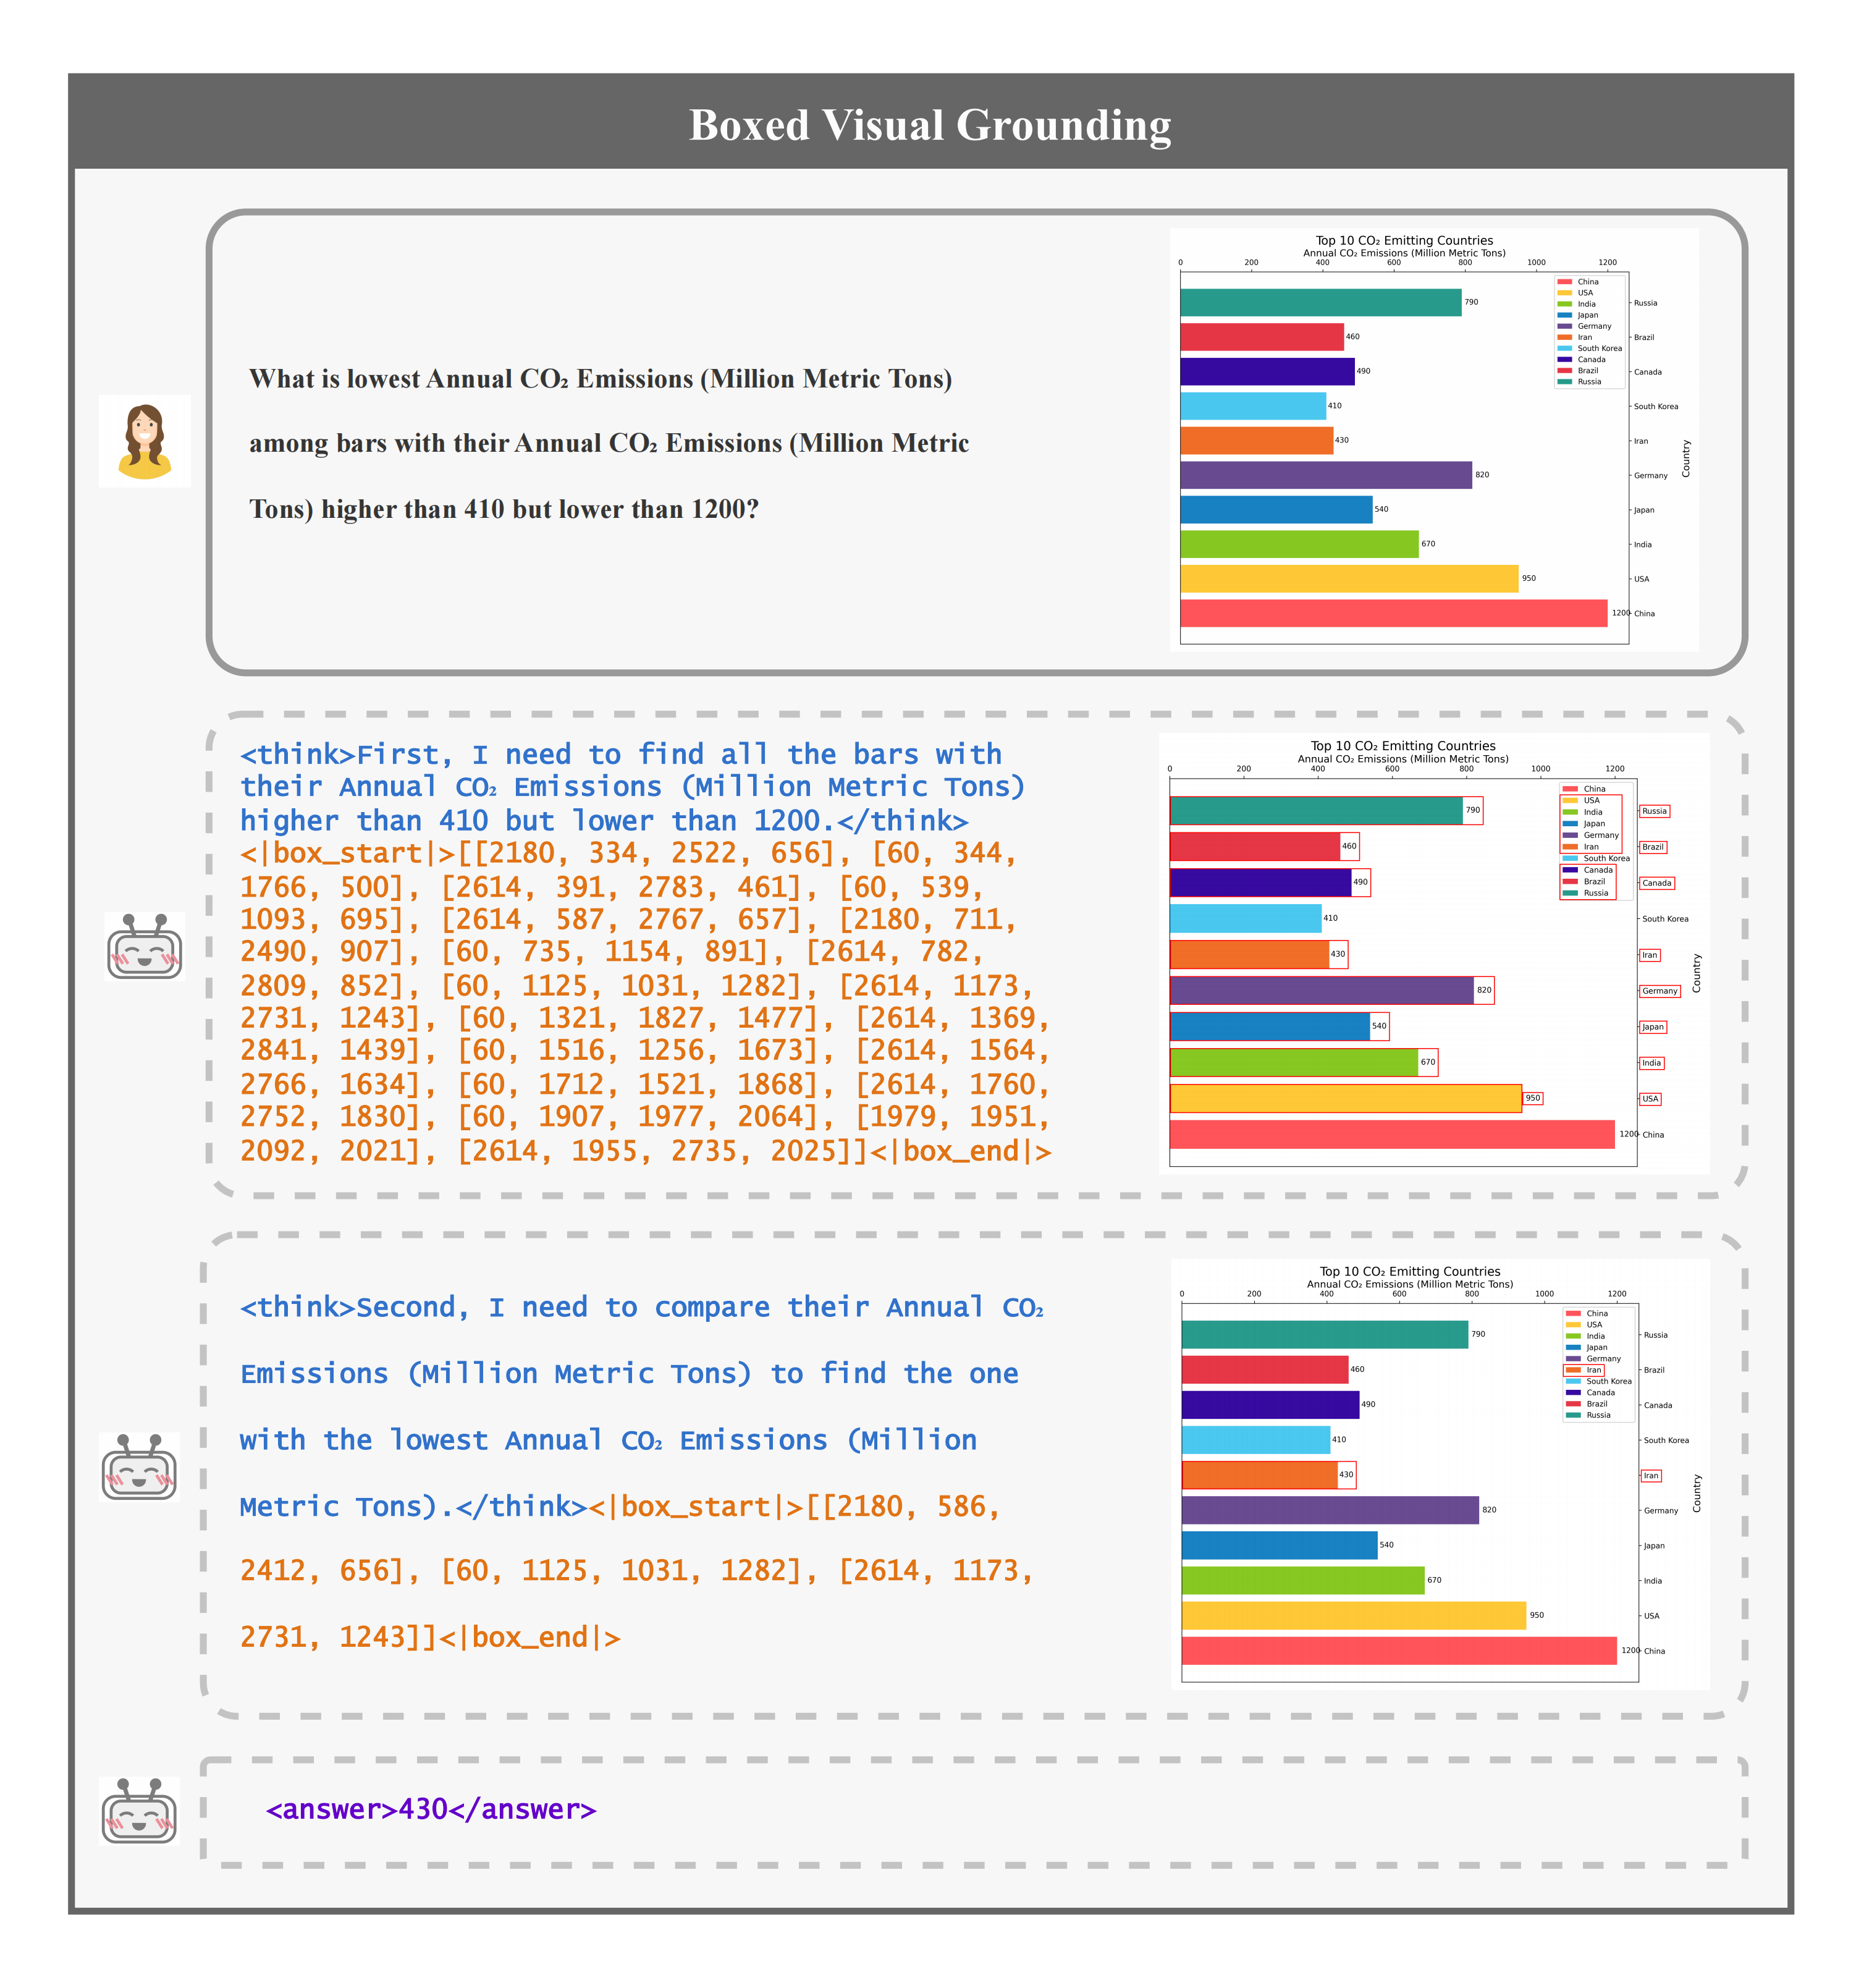
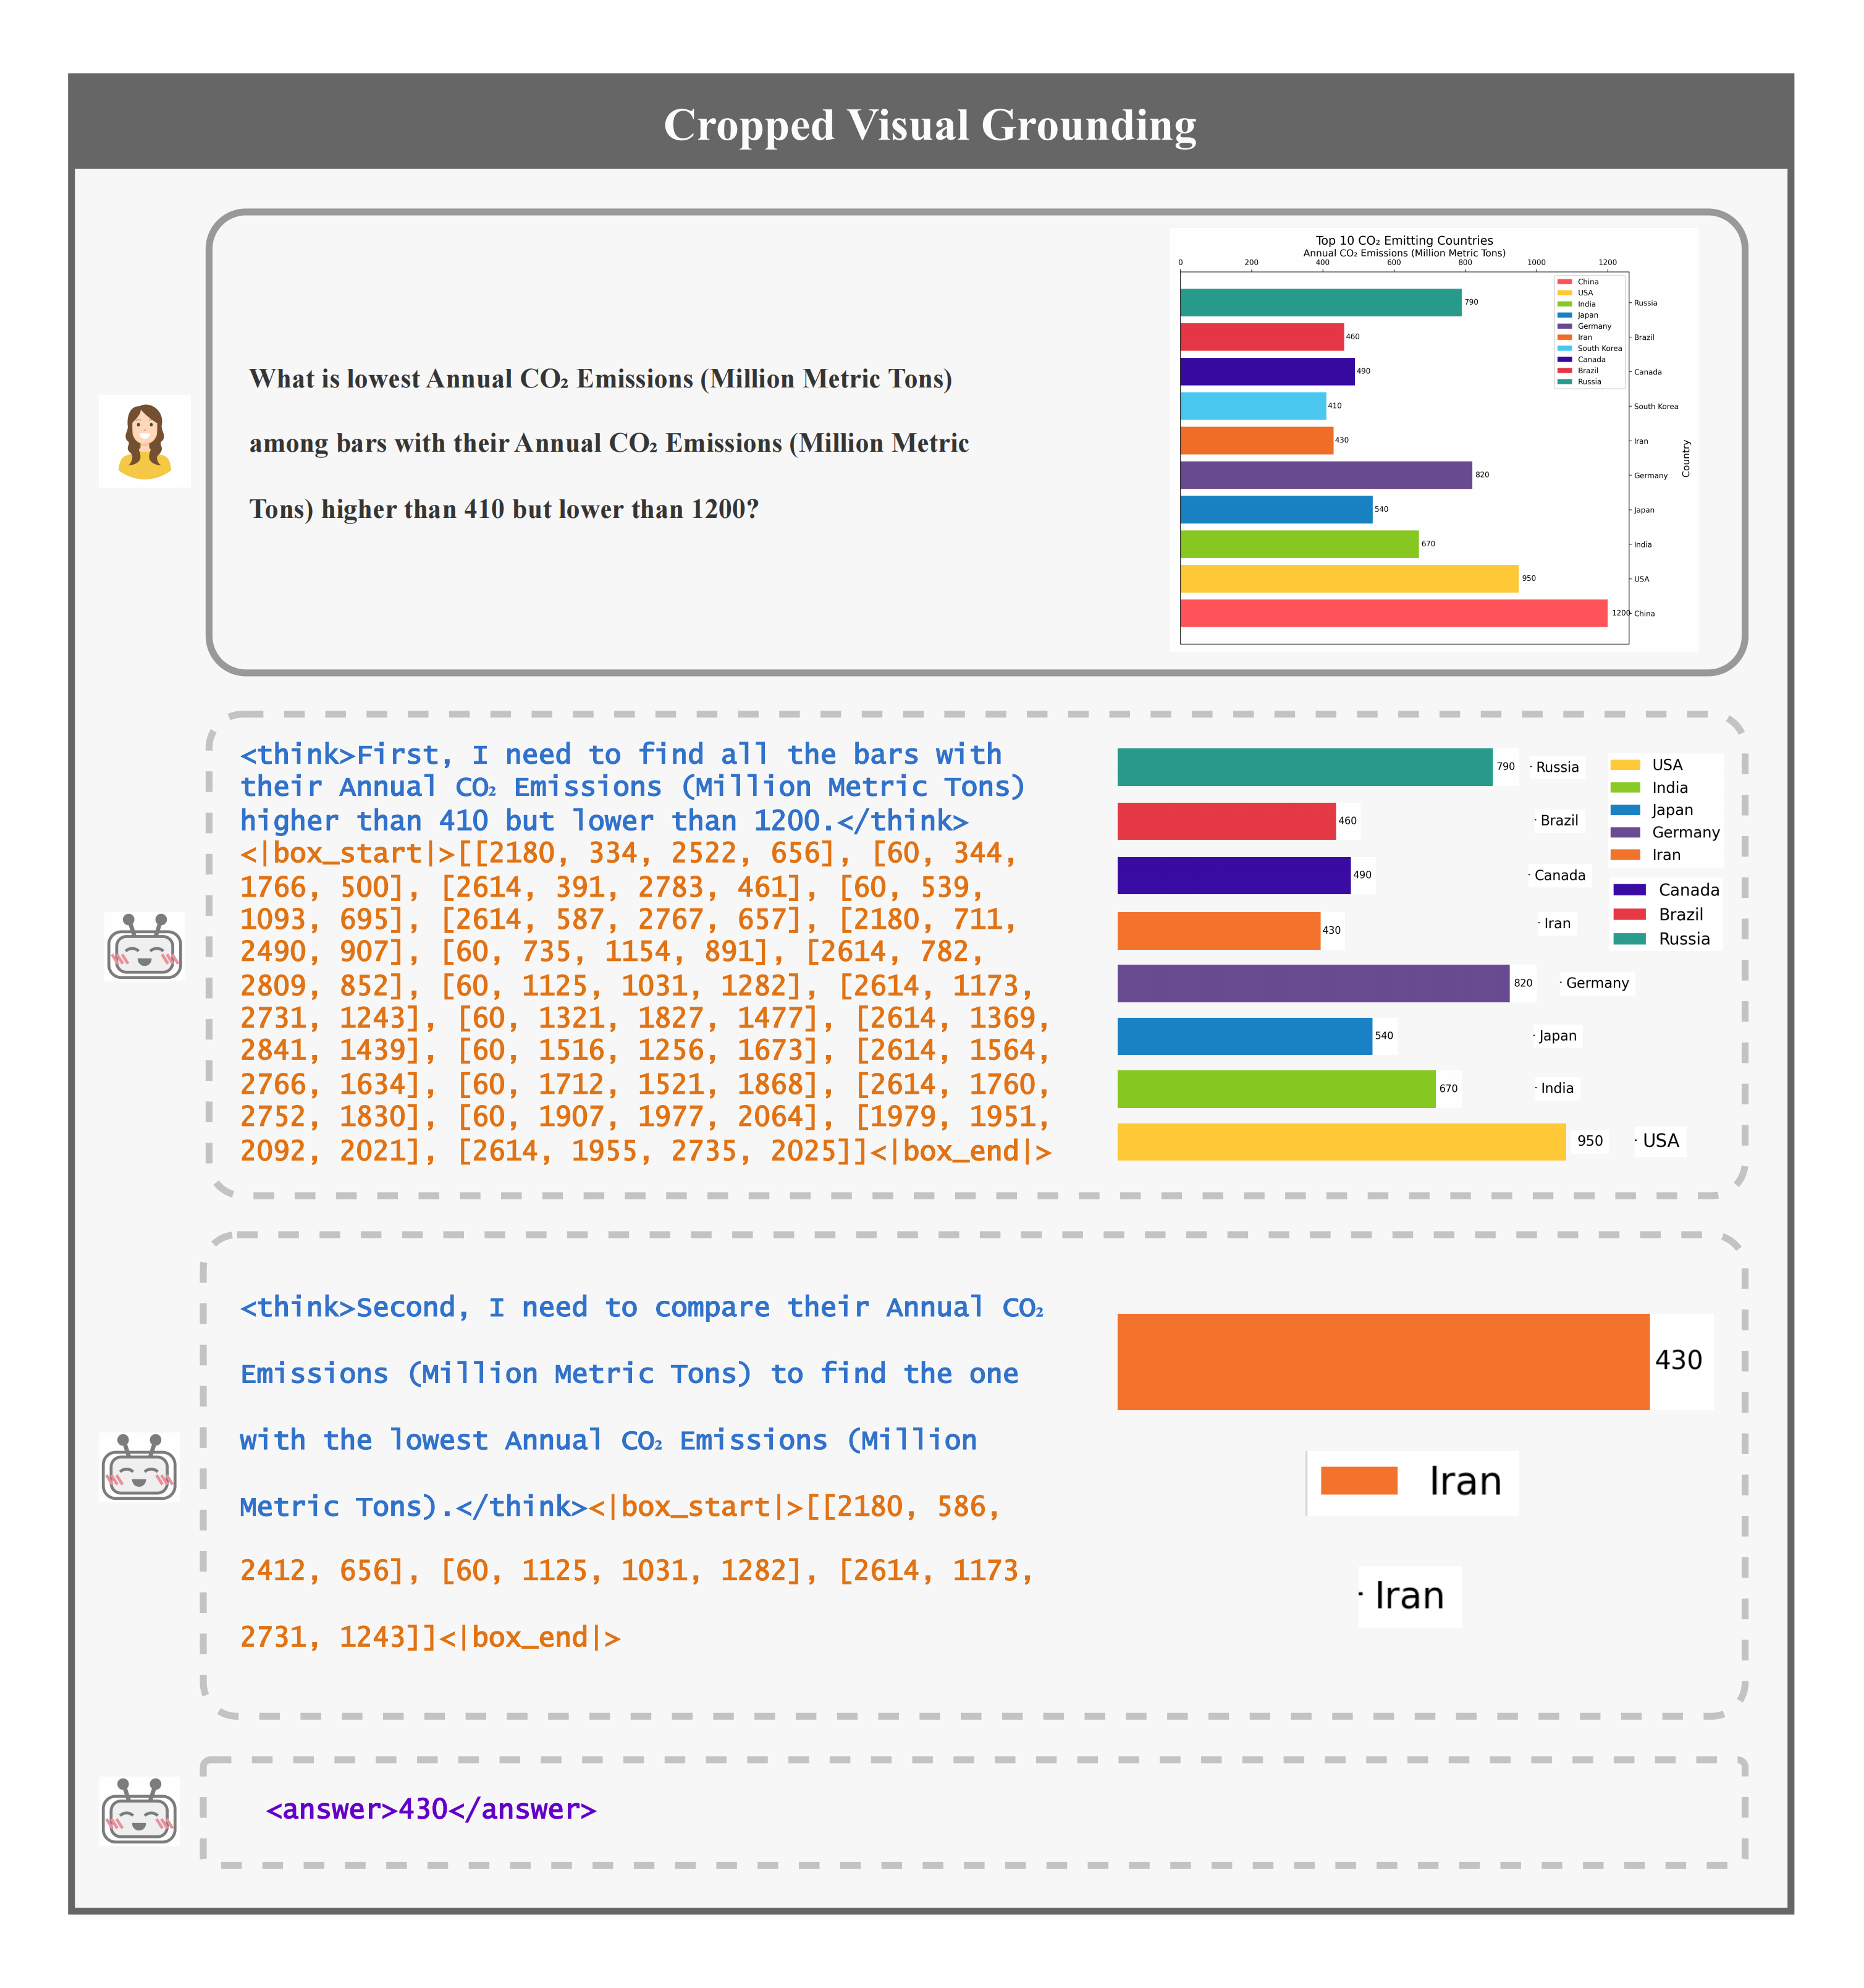
Three strategies dynamically shift the visual focus as reasoning progresses. All follow the same RVA process — the model emits reasoning with grounded box coordinates — but differ in how the grounded state is rendered back to the model.
Applied — Highlighting the Focus
Predicted regions are underlined with semi-transparent yellow overlays. As reasoning progresses the highlight shifts to mirror each step, preserving full visual context. This is CURV's main method.
I'vis,t = Iorig ⊙ (1 − κ · Mfocus,t) + κ · Hyellow ⊙ Mfocus,t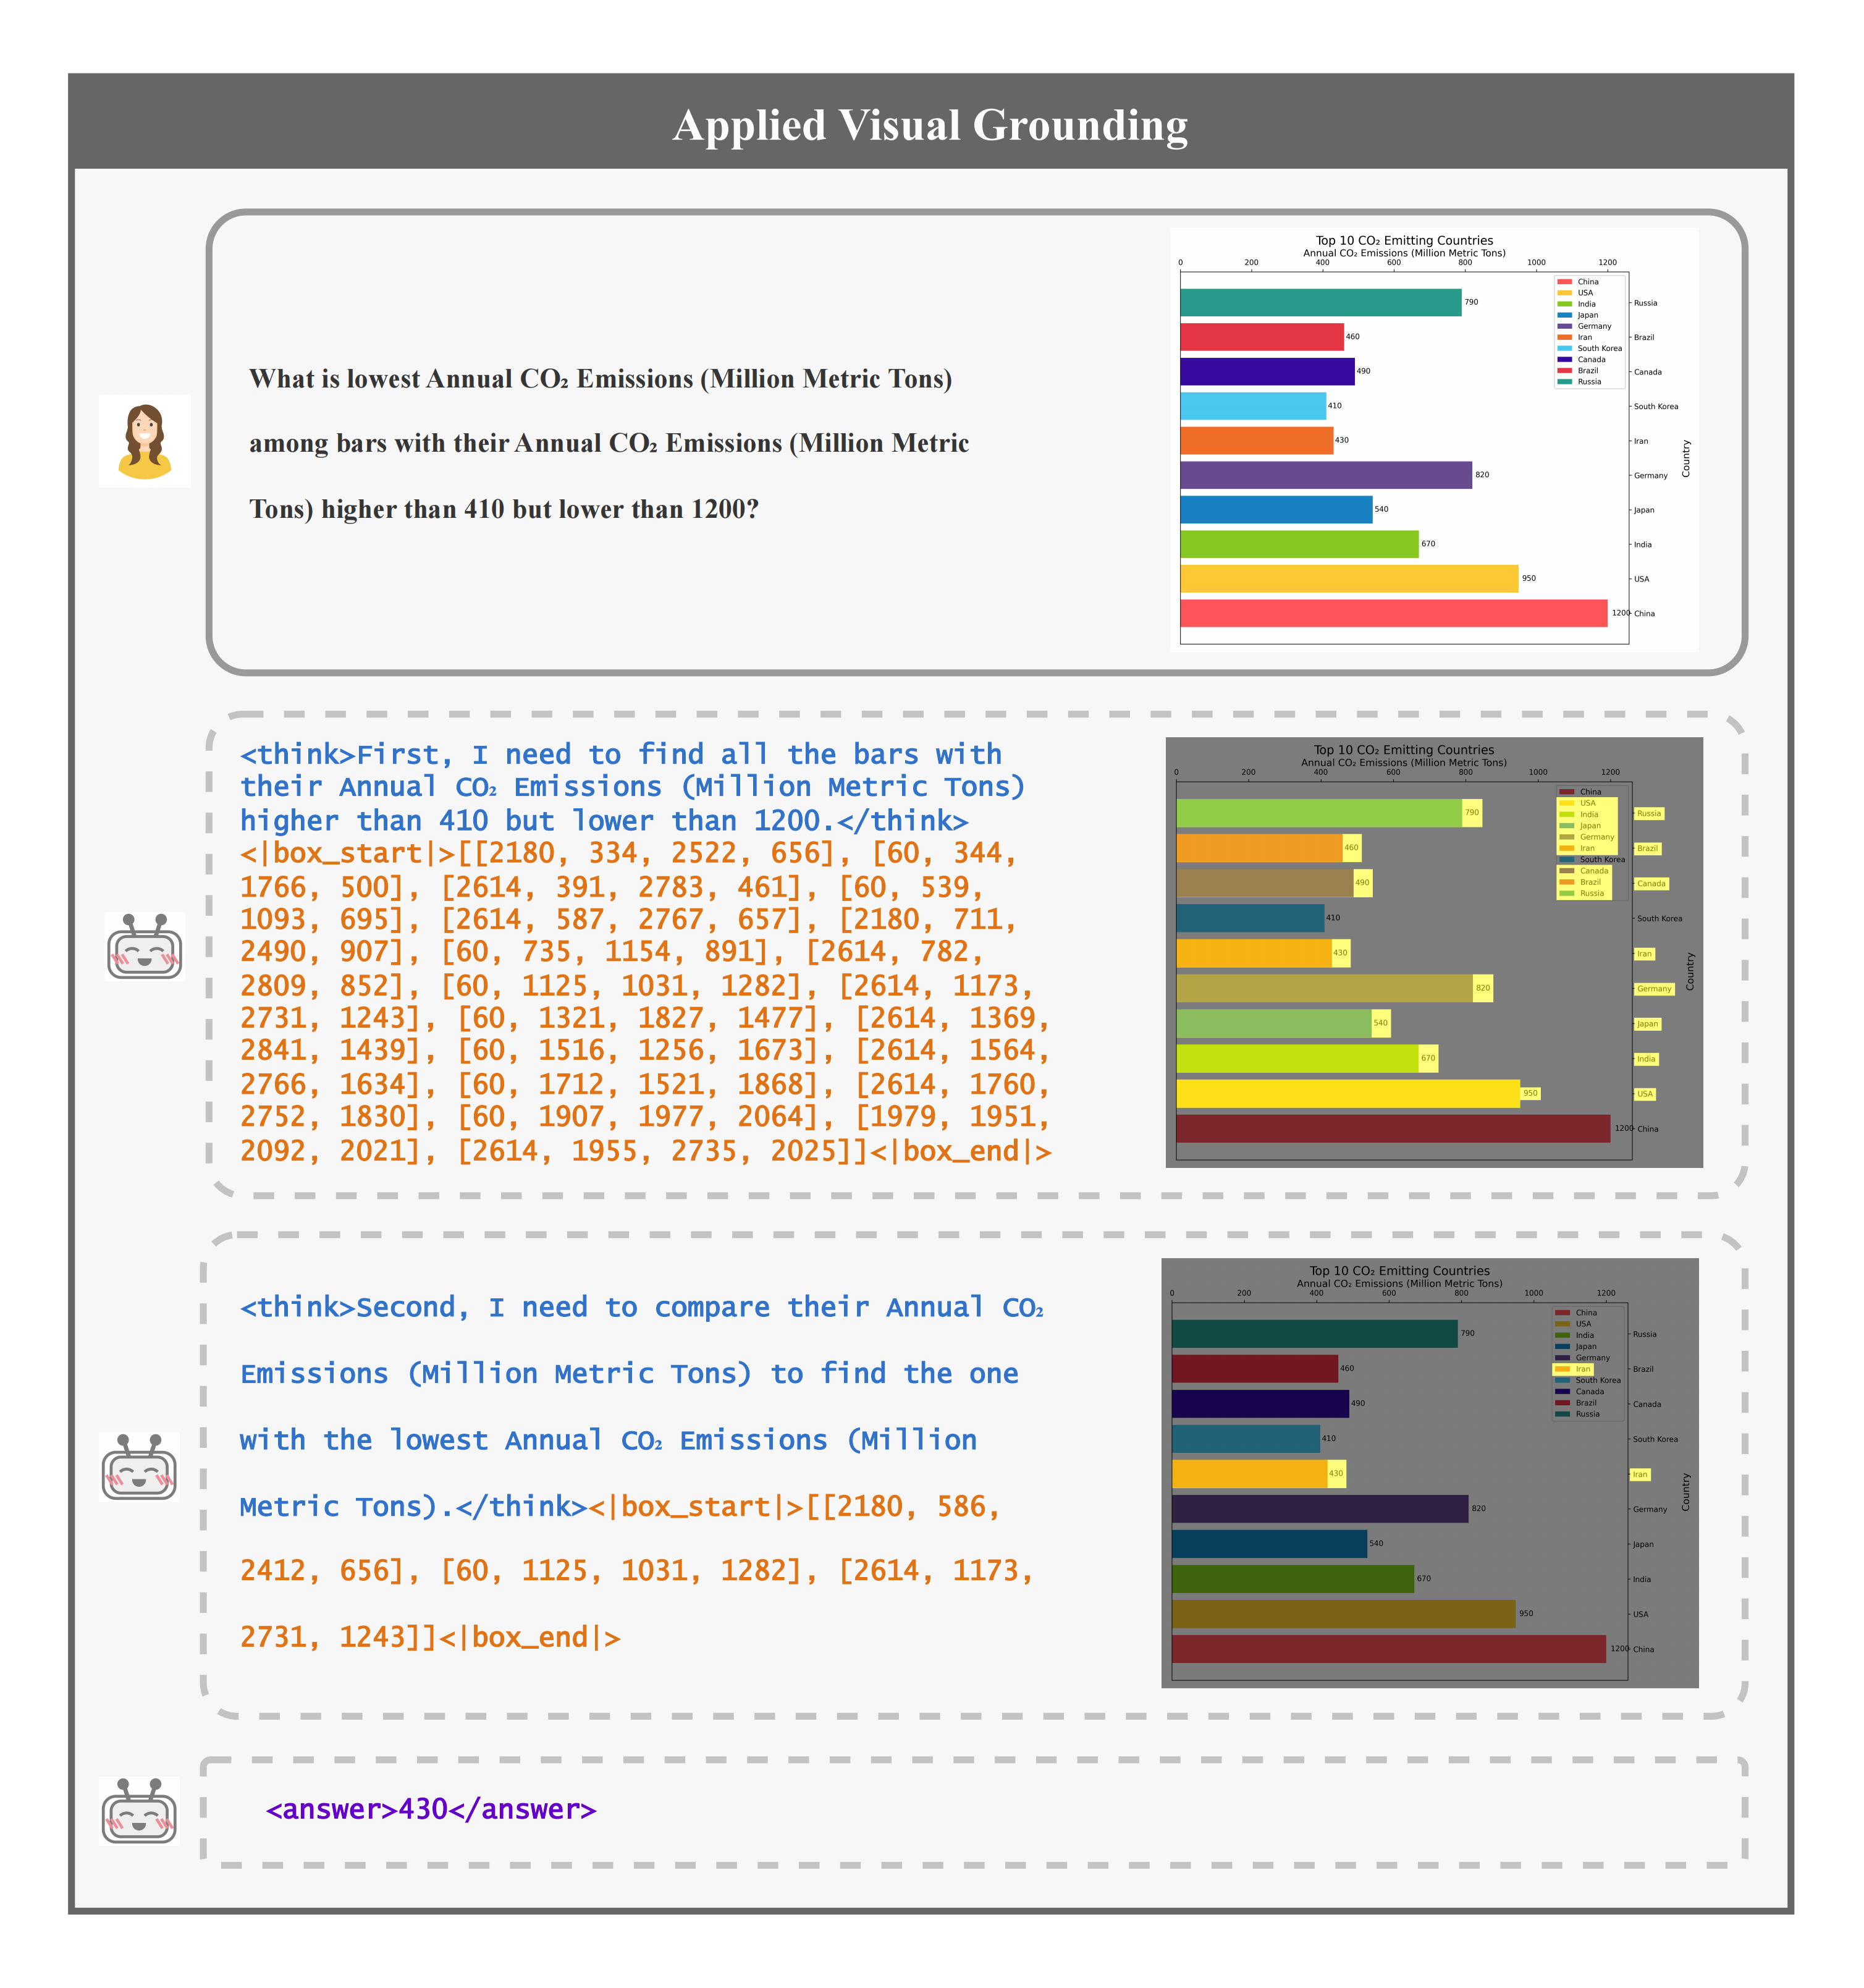
Trade-offs Across Strategies
| Method | Low Computation | High Precision | Full Context | No Occlusion | Multi-Region | Easy Integration | Easy Comprehension |
|---|---|---|---|---|---|---|---|
| applied | ✓ | ✗ | ✓ | ✗ | ✓ | ✓ | ✓ |
| boxed | ✓ | ✗ | ✓ | ✓ | ✓ | ✓ | ✓ |
| cropped | ✗ | ✓ | ✓ | ✓ | ✓ | ✗ | ✗ |
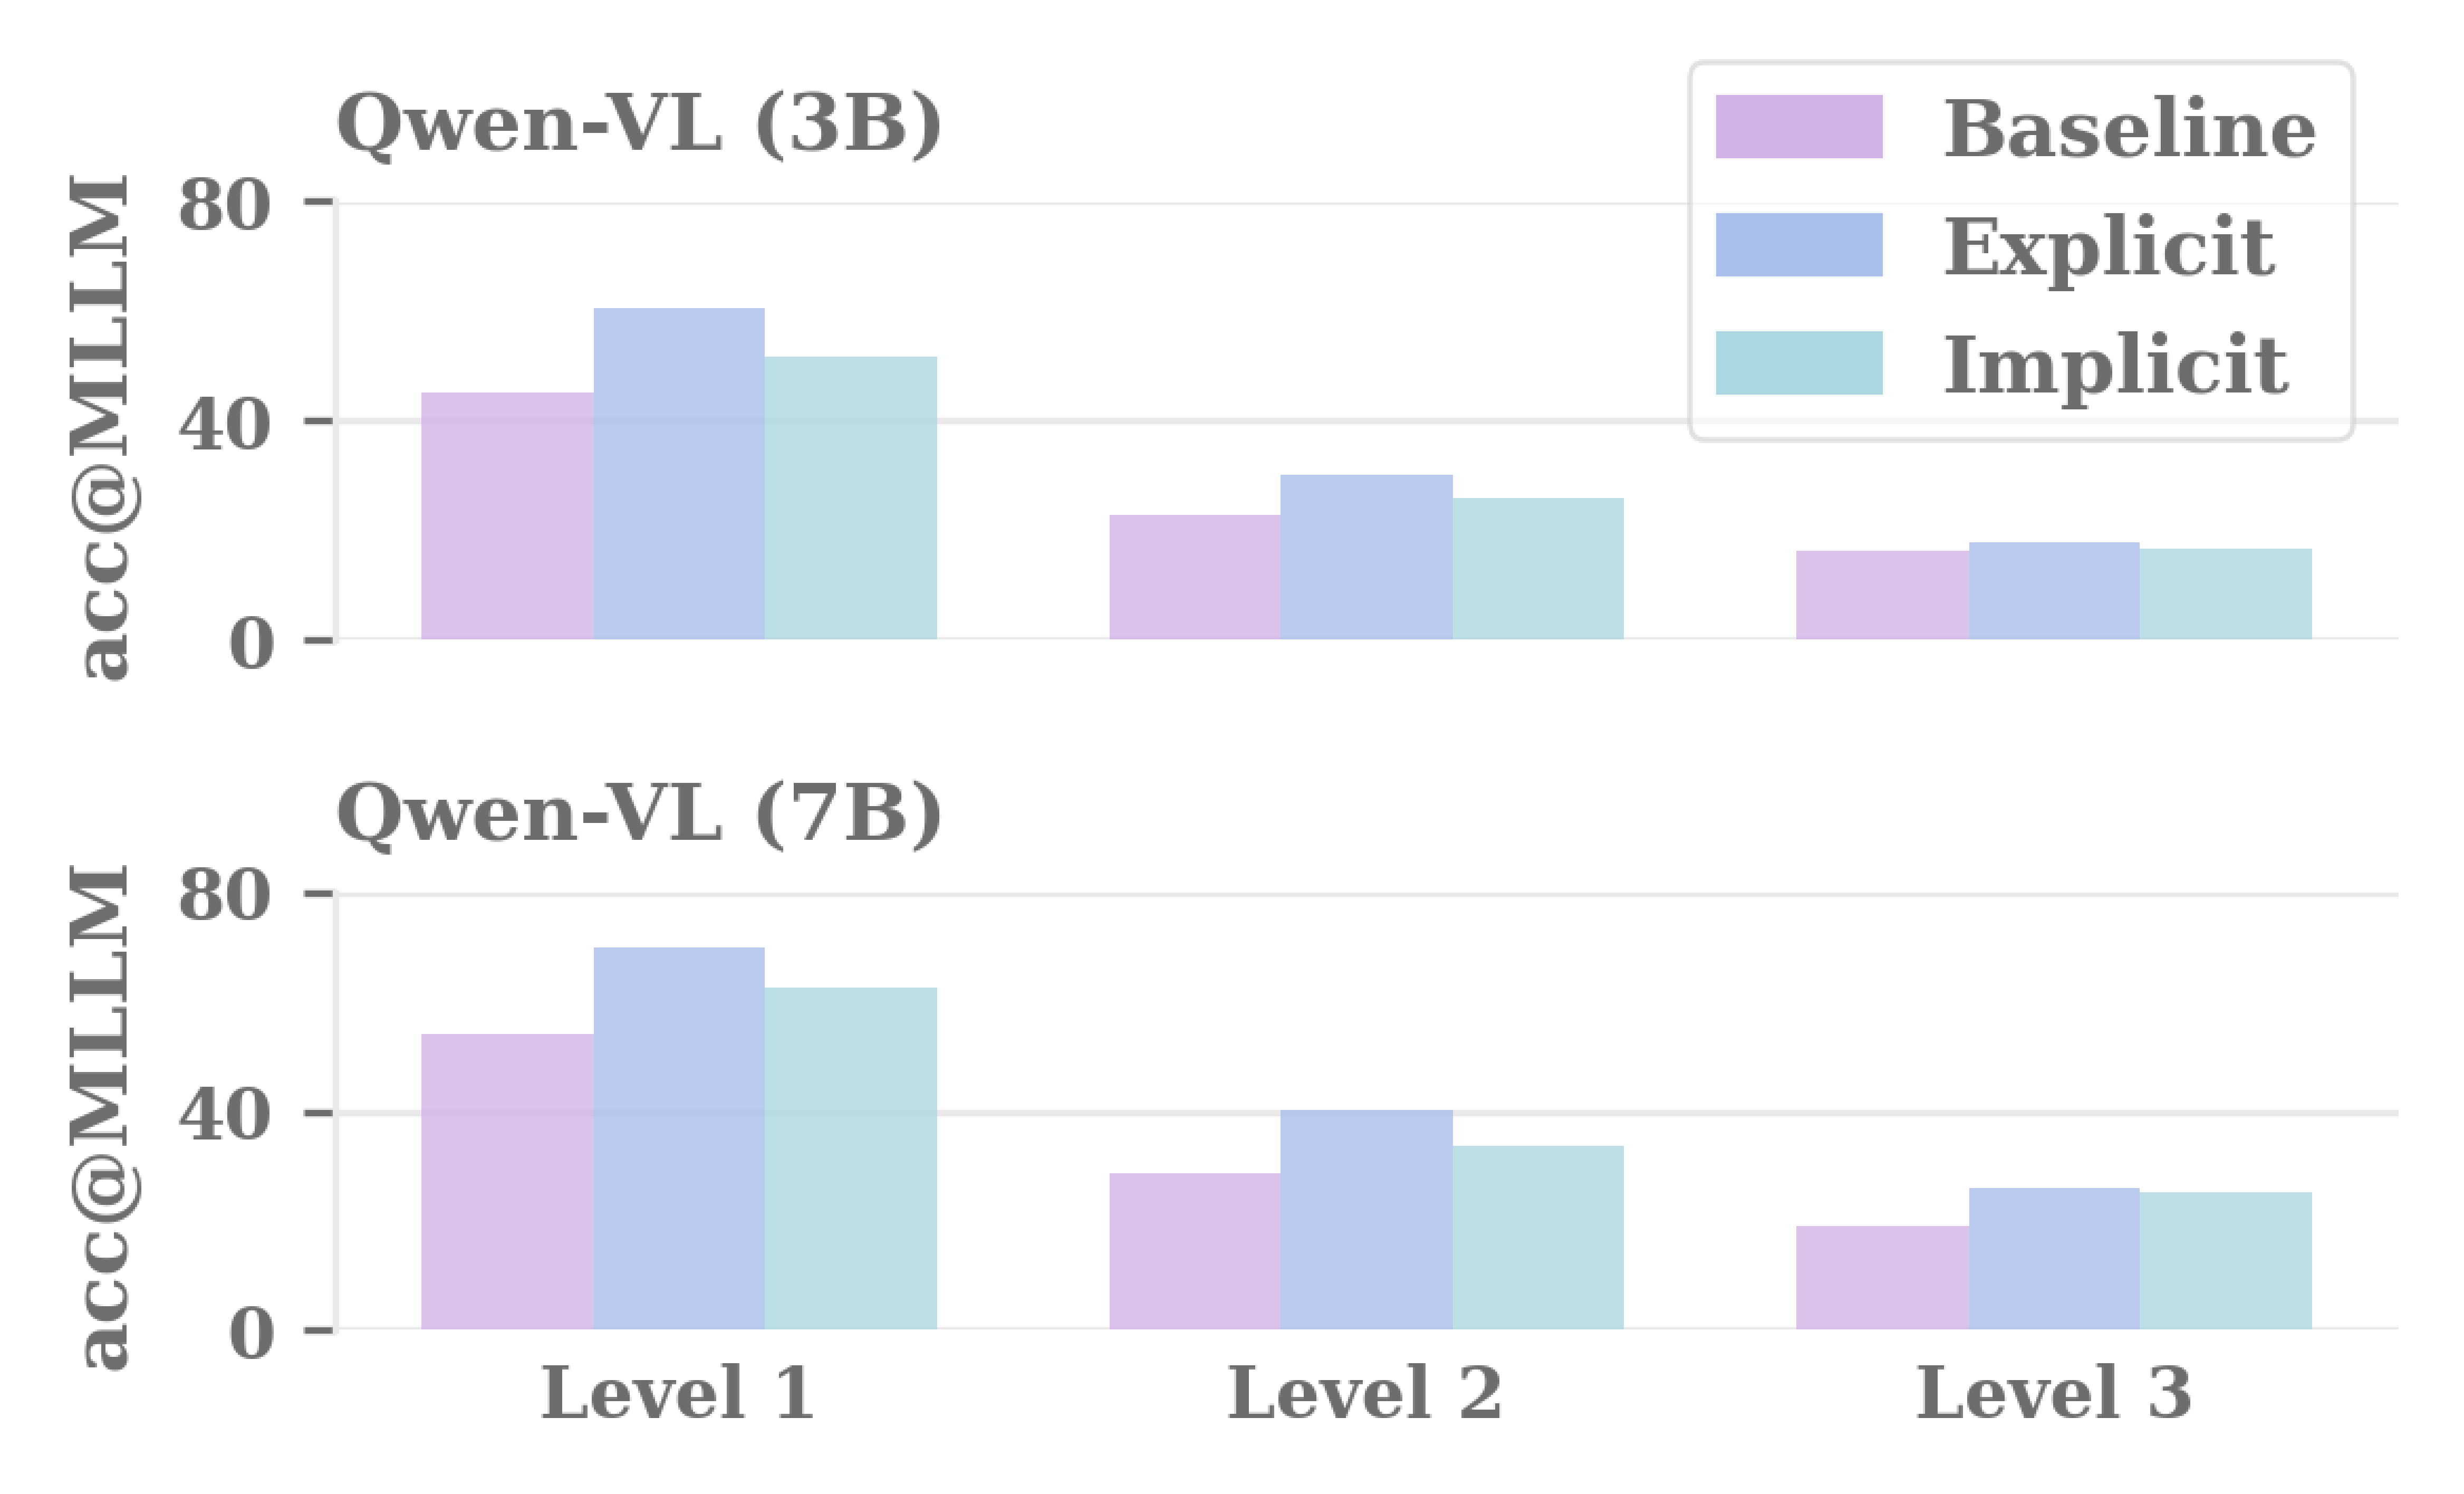
Explicit grounding wins
Explicit visual grounded reasoning consistently outperforms its implicit counterpart by ↑8.78%.
Grounding is most valuable as an intermediate vision–reasoning bridge, not as the ultimate learning objective.
Experiments
Performance on CCQA
Five accuracy metrics per curriculum level: acc@M uses an MLLM judge, and acc@0.0 through acc@0.2 apply progressively relaxed rule-based thresholds.
| Model | Size | Level 1 | Level 2 | Level 3 | ||||||||||||
|---|---|---|---|---|---|---|---|---|---|---|---|---|---|---|---|---|
| @M | @0.0 | @0.05 | @0.1 | @0.2 | @M | @0.0 | @0.05 | @0.1 | @0.2 | @M | @0.0 | @0.05 | @0.1 | @0.2 | ||
| Close-Source MLLMs | ||||||||||||||||
| GPT-4o | – | 57.64 | 54.07 | 62.00 | 65.36 | 70.50 | 34.04 | 33.75 | 44.93 | 50.54 | 57.96 | 22.14 | 22.29 | 30.25 | 34.04 | 39.14 |
| GPT-4.1-mini | – | 70.86 | 67.43 | 76.29 | 78.79 | 79.93 | 37.61 | 36.54 | 47.18 | 52.93 | 60.86 | 26.14 | 25.46 | 33.11 | 37.79 | 42.32 |
| Open-Source Baselines | ||||||||||||||||
| Gemma-3 | 4B | 38.21 | 28.64 | 32.79 | 37.00 | 41.29 | 18.07 | 12.86 | 18.82 | 23.64 | 28.29 | 11.43 | 9.64 | 13.14 | 15.54 | 18.96 |
| Llama-3.2-V | 11B | 44.86 | 38.29 | 40.86 | 42.86 | 47.07 | 23.43 | 18.25 | 22.46 | 25.29 | 29.39 | 16.57 | 14.25 | 16.54 | 18.29 | 20.29 |
| InternVL3 | 1B | 20.54 | 16.38 | 20.53 | 24.40 | 29.68 | 8.51 | 7.44 | 12.61 | 15.37 | 20.65 | 6.76 | 5.87 | 8.31 | 10.09 | 10.99 |
| InternVL3 | 2B | 33.53 | 32.52 | 37.52 | 42.52 | 47.29 | 13.11 | 13.22 | 19.89 | 27.14 | 35.55 | 10.69 | 11.18 | 14.71 | 18.72 | 24.90 |
| InternVL3 | 8B | 46.79 | 44.29 | 52.14 | 57.71 | 63.00 | 25.75 | 25.57 | 35.36 | 41.64 | 50.79 | 17.84 | 17.48 | 24.57 | 28.93 | 34.68 |
| Qwen2.5-VL | 3B | 45.25 | 43.52 | 51.54 | 56.25 | 61.54 | 22.75 | 22.86 | 31.14 | 37.21 | 45.36 | 16.18 | 16.00 | 21.89 | 25.82 | 31.71 |
| Qwen2.5-VL | 7B | 54.21 | 50.79 | 60.43 | 64.64 | 69.29 | 28.68 | 28.82 | 39.93 | 45.54 | 52.61 | 19.01 | 19.38 | 26.71 | 31.50 | 36.93 |
| Ours: Stage II only | ||||||||||||||||
| Applied (InternVL3) | 1B | 25.79 | 21.36 | 25.29 | 31.43 | 37.86 | 10.57 | 9.25 | 12.89 | 17.18 | 22.21 | 7.11 | 7.36 | 9.25 | 11.00 | 12.93 |
| Applied (InternVL3) | 2B | 42.64 | 41.79 | 48.71 | 55.36 | 62.14 | 18.68 | 19.29 | 25.79 | 32.93 | 41.50 | 11.39 | 12.57 | 16.61 | 20.75 | 26.32 |
| Applied (InternVL3) | 8B | 58.86 | 54.64 | 66.29 | 69.14 | 71.79 | 34.47 | 33.90 | 49.67 | 56.47 | 63.91 | 18.87 | 19.84 | 27.99 | 31.97 | 37.41 |
| Applied (Qwen2.5-VL) | 3B | 54.21 | 51.21 | 59.50 | 65.00 | 68.50 | 25.86 | 27.14 | 39.18 | 47.25 | 55.18 | 16.86 | 17.32 | 23.93 | 28.61 | 33.11 |
| Applied (Qwen2.5-VL) | 7B | 65.79 | 59.14 | 71.93 | 75.29 | 78.29 | 36.82 | 34.79 | 50.82 | 56.18 | 62.75 | 21.04 | 21.11 | 30.21 | 34.25 | 39.39 |
| Boxed (Qwen2.5-VL) | 3B | 58.07 | 51.79 | 61.00 | 65.71 | 69.86 | 25.96 | 25.32 | 37.75 | 45.89 | 53.86 | 16.92 | 16.82 | 22.89 | 27.21 | 33.29 |
| Boxed (Qwen2.5-VL) | 7B | 59.79 | 52.79 | 71.93 | 74.57 | 76.64 | 33.79 | 30.32 | 49.75 | 55.89 | 62.21 | 20.14 | 18.04 | 28.89 | 32.32 | 36.29 |
| Cropped (Qwen2.5-VL) | 3B | 49.71 | 46.79 | 54.86 | 60.07 | 65.21 | 20.68 | 21.11 | 32.61 | 40.36 | 50.82 | 15.00 | 18.89 | 20.96 | 24.71 | 30.25 |
| Cropped (Qwen2.5-VL) | 7B | 58.93 | 56.57 | 67.71 | 72.93 | 76.71 | 30.04 | 29.71 | 40.43 | 46.71 | 53.79 | 18.68 | 18.71 | 26.79 | 30.36 | 35.11 |
| Ours: Stage I + II | ||||||||||||||||
| Applied (InternVL3) | 1B | 28.64 | 26.79 | 31.57 | 36.36 | 43.79 | 14.18 | 12.86 | 16.25 | 22.86 | 27.43 | 10.39 | 10.64 | 13.46 | 15.79 | 17.75 |
| Applied (InternVL3) | 2B | 47.86 | 46.93 | 54.71 | 60.57 | 67.79 | 23.36 | 23.61 | 28.79 | 36.57 | 43.36 | 14.89 | 15.82 | 20.29 | 24.79 | 31.39 |
| Applied (InternVL3) | 8B | 67.71 | 62.57 | 70.57 | 75.14 | 77.29 | 39.68 | 37.79 | 52.54 | 58.71 | 65.04 | 24.57 | 22.96 | 30.54 | 34.79 | 40.32 |
| Applied (Qwen2.5-VL) | 3B | 60.64 | 57.21 | 63.71 | 69.57 | 73.79 | 30.11 | 29.61 | 41.82 | 48.86 | 57.64 | 17.96 | 18.21 | 24.25 | 29.07 | 34.50 |
| Applied (Qwen2.5-VL) | 7B | 69.86 | 66.79 | 75.29 | 78.50 | 80.43 | 40.21 | 38.64 | 54.00 | 60.04 | 66.89 | 26.11 | 24.25 | 32.21 | 36.96 | 42.54 |
| Boxed (Qwen2.5-VL) | 3B | 58.50 | 54.71 | 64.21 | 72.57 | 74.79 | 27.64 | 26.86 | 38.75 | 46.86 | 55.36 | 17.43 | 17.54 | 23.50 | 27.96 | 33.46 |
| Boxed (Qwen2.5-VL) | 7B | 63.29 | 59.57 | 72.14 | 75.86 | 77.00 | 35.32 | 33.57 | 51.54 | 57.54 | 64.36 | 23.57 | 22.14 | 31.96 | 35.04 | 38.25 |
| Cropped (Qwen2.5-VL) | 3B | 53.07 | 50.79 | 57.71 | 63.57 | 69.50 | 23.29 | 23.54 | 34.29 | 41.43 | 51.54 | 17.14 | 18.04 | 22.46 | 26.11 | 33.04 |
| Cropped (Qwen2.5-VL) | 7B | 62.14 | 60.71 | 69.57 | 74.71 | 77.86 | 32.25 | 31.82 | 46.32 | 50.57 | 57.36 | 20.11 | 20.36 | 28.46 | 33.86 | 37.11 |
- Up to ↑20.92% absolute gain for two-stage training over baselines.
- CURV@Applied (Qwen2.5-VL-7B) is strongest, beating its base model by up to ↑15.65% and GPT models by up to ↑12.22%.
- Generalizes past its training distribution — trained only on single-plot charts, it still improves on multi-chart level 3 by up to ↑7.10%.
Ablations
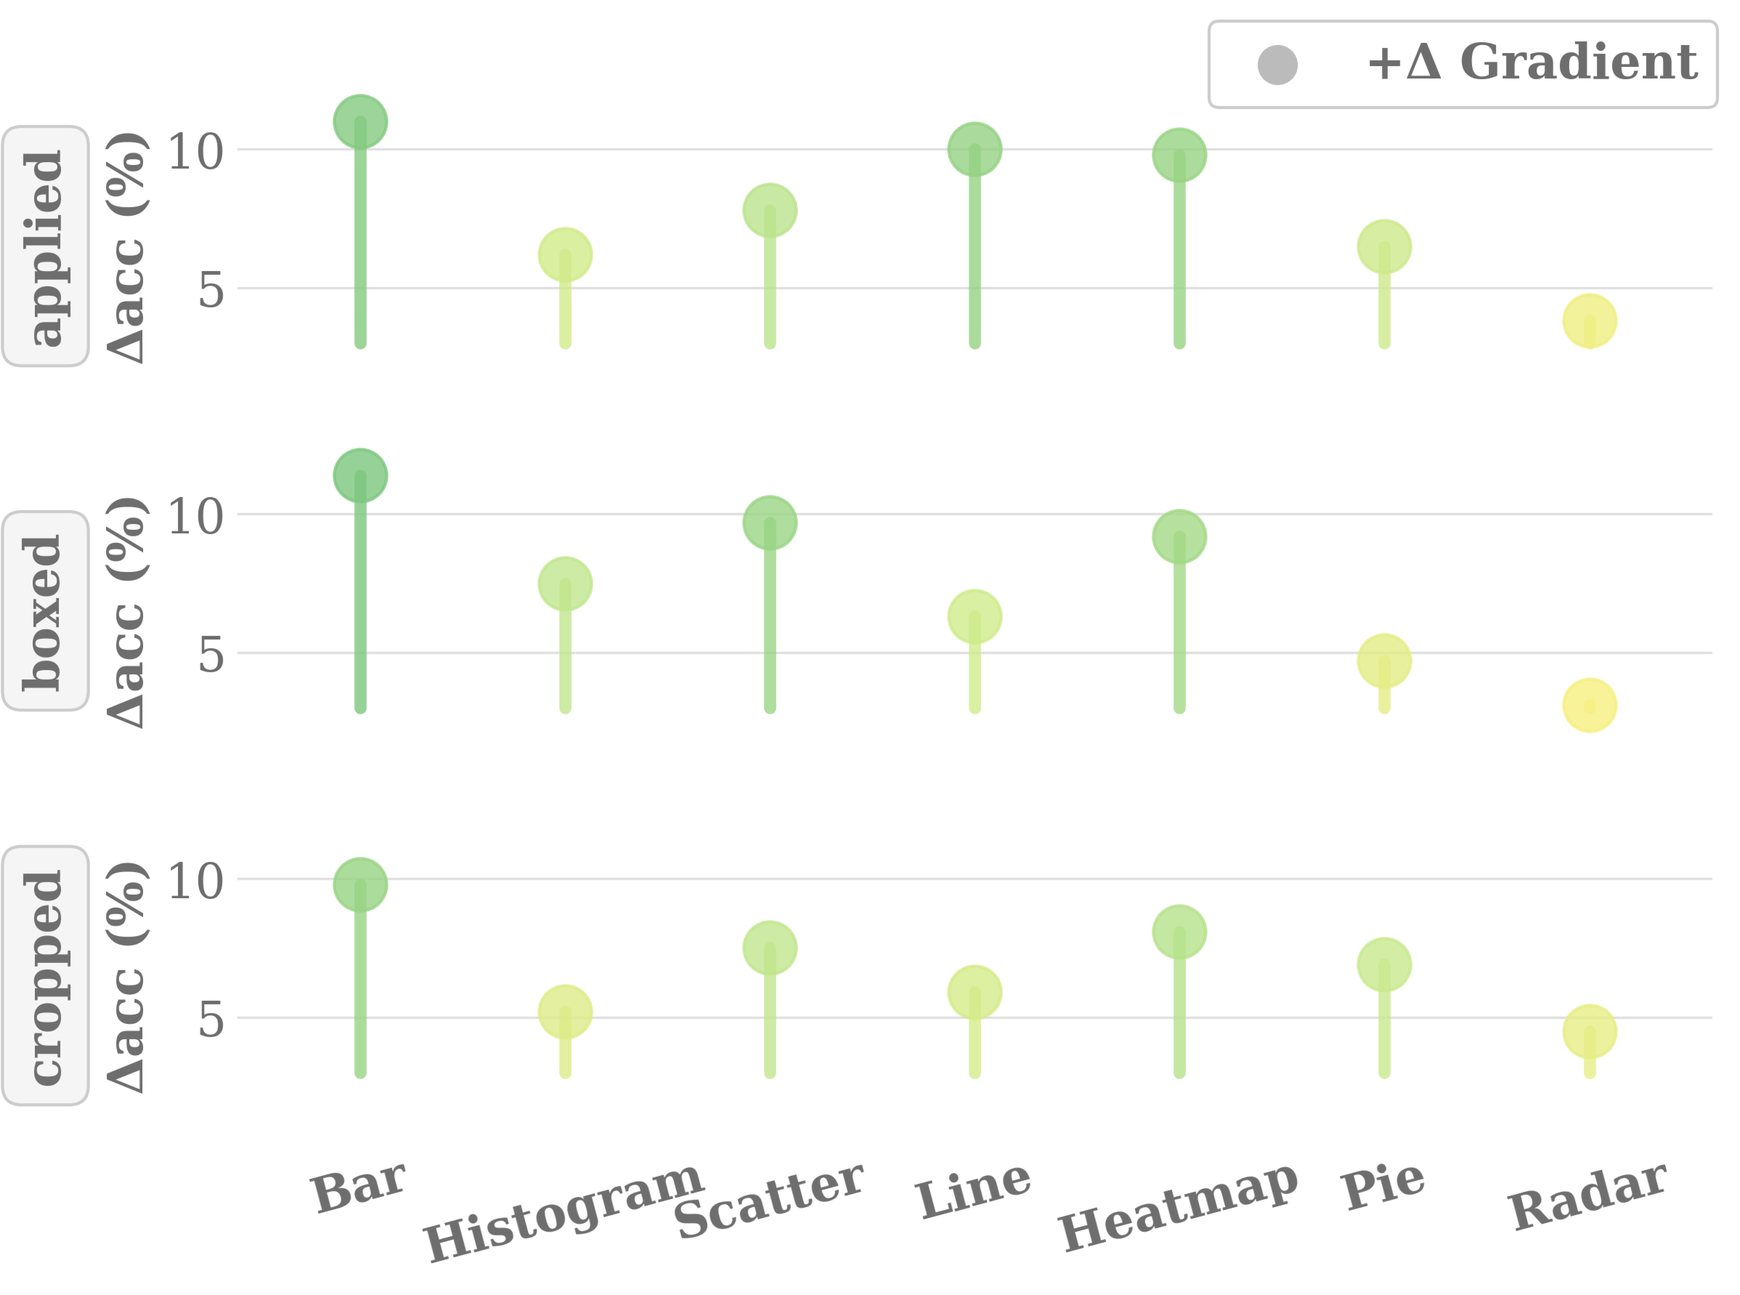
Gains hold across chart types
Bar charts benefit most, followed by line plots and heatmaps. Radar gains least, reflecting its lower prevalence in the curriculum.
Applied, boxed, and cropped show distinct distributions, indicating the grounding strategies suit different chart structures.
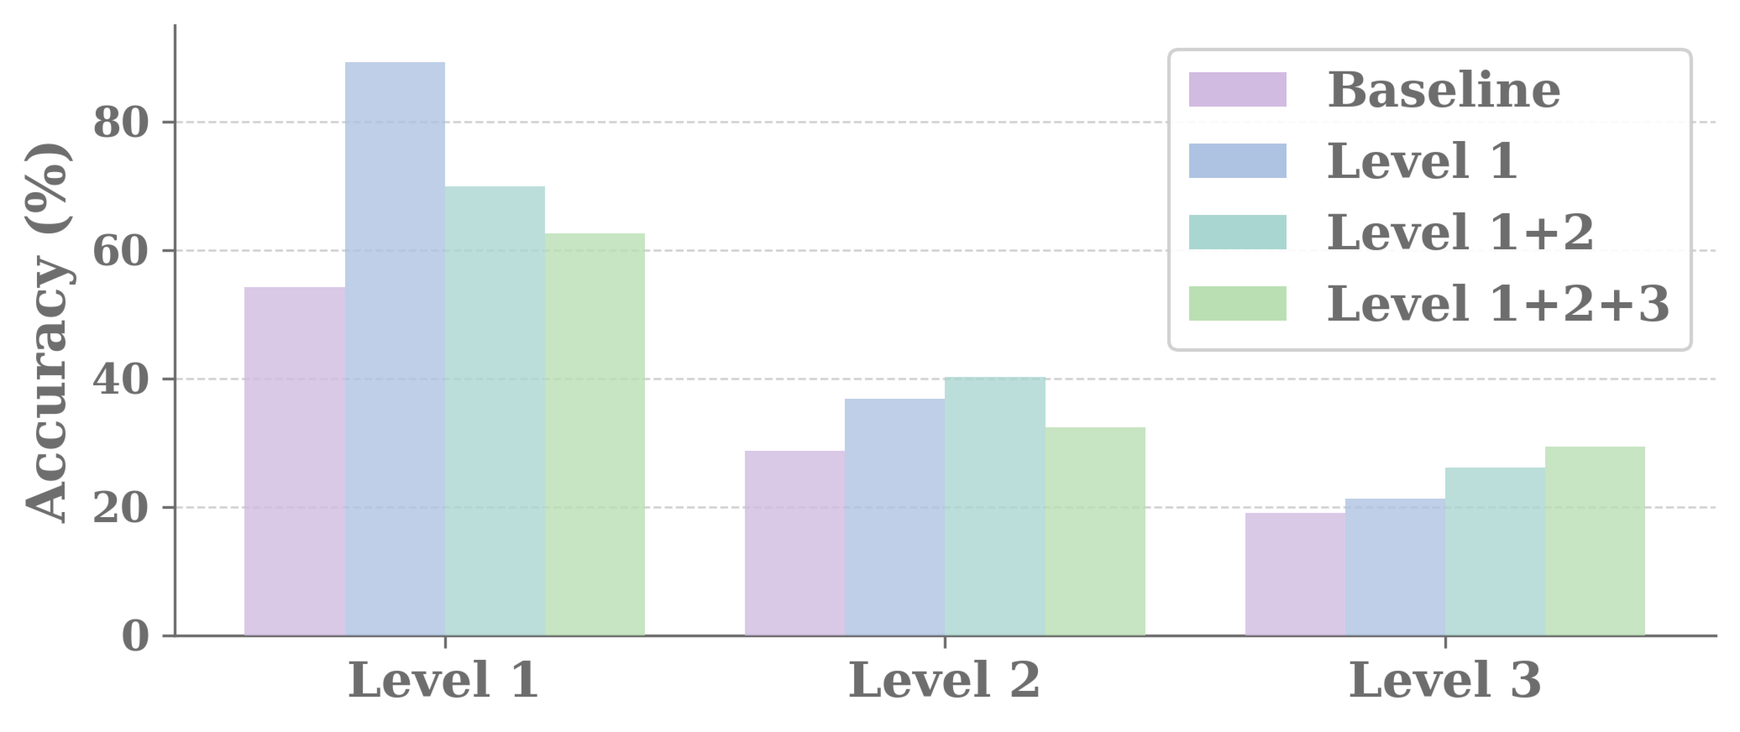
Foundations drive balanced gains
Training on levels 1+2 gives the most consistent improvement across all difficulties. Relying on level 3 alone is markedly less effective.
Foundational learning is what makes visual reasoning adaptable rather than narrow.
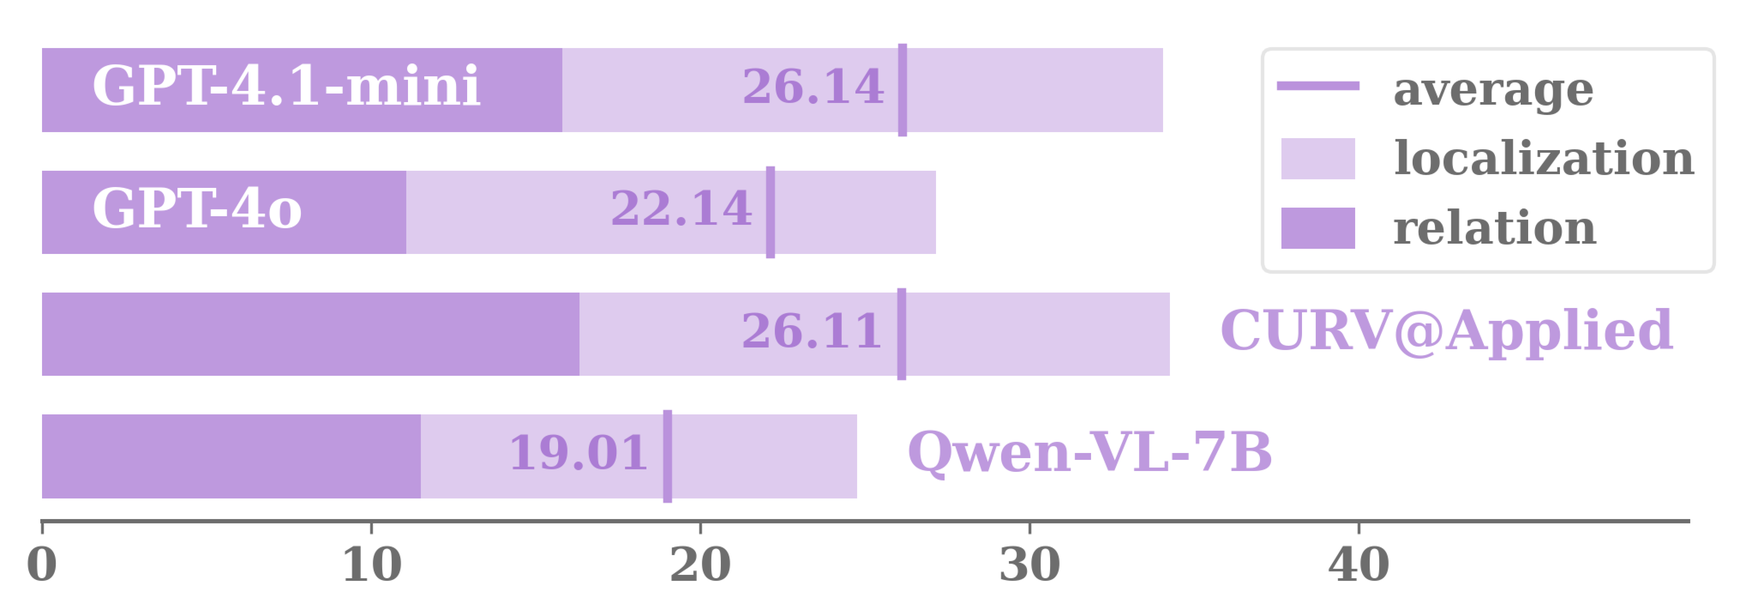
Multi-chart understanding
On curriculum level 3, CURV improves subplot localization by ↑4.68% and cross-chart relation understanding by ↑2.42%.
Gains come from reasoning grounded in visual structure, not task-specific adaptation.
Resources
Citation
@inproceedings{guo2026curv,
  title     = {CURV: Enhancing Chart Understanding Through Curriculum Visual Grounded Reasoning},
  author    = {Guo, Xuehang and Zhang, Pingyue and Zhang, Ruiyi and Wang, Zhenhailong and Lyu, Hanrui and Ji, Heng and Sun, Tong and Wang, Qingyun and Li, Manling},
  booktitle = {In Proceedings of Conference on Language Modeling 2026 (COLM 2026)},
  year      = {2026}
}